
Figure 1.
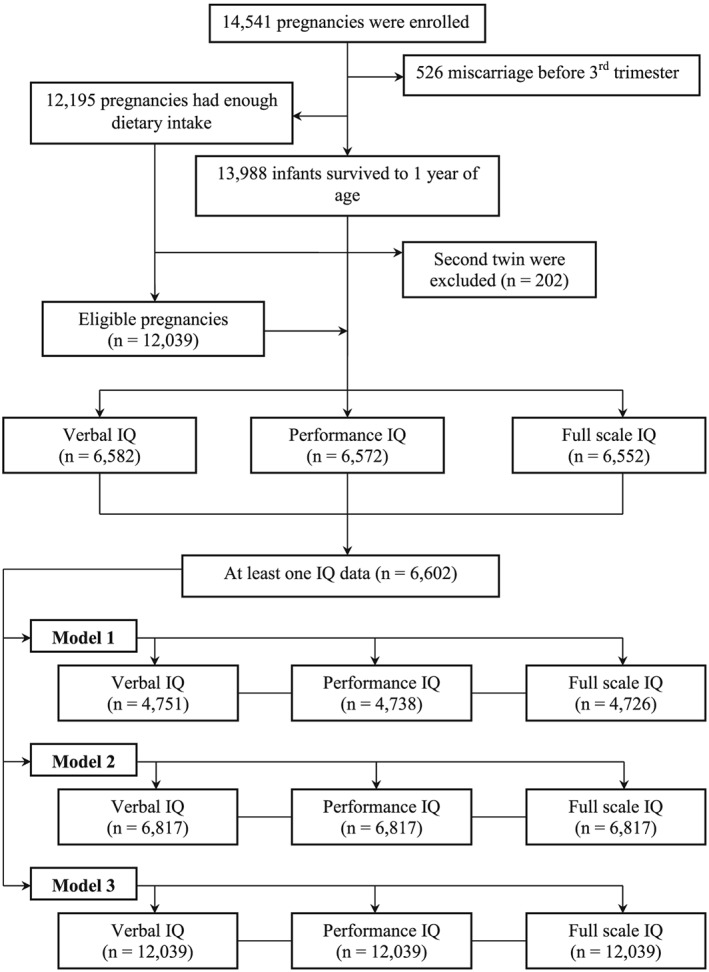
Flow chart illustrating the participant data of the study. Model 1, all available data; Model 2, imputations for missing data of intelligence quotients (IQ) and all confounders, only up to the sample for complete the IQ scale at 8 years and child neurodevelopment data assessed before 8 years of age, which were correlated to IQ; Model 3, imputations for missing data of IQ and all confounders