
Figure 1.
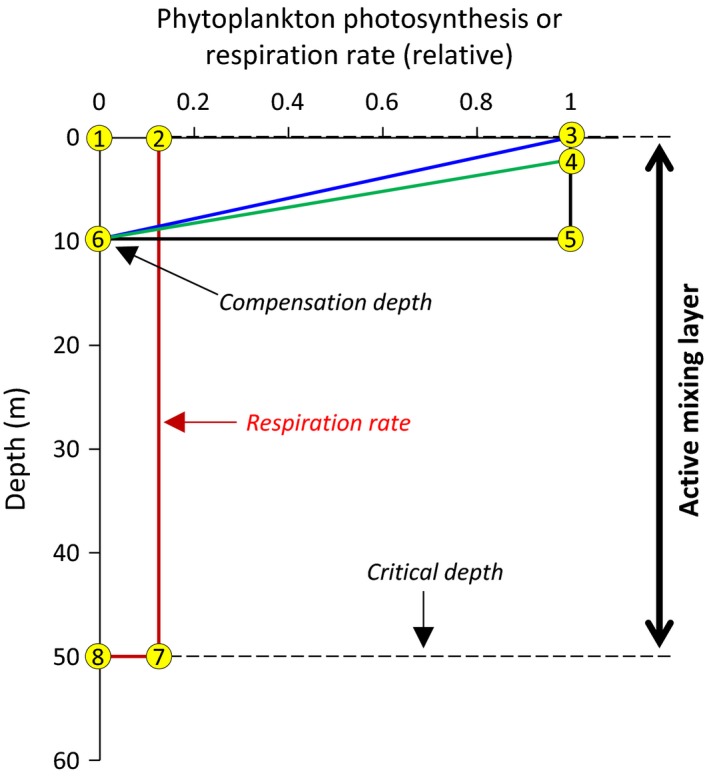
Visual illustration of the original critical depth calculation by Gran and Braarud (1935) for a water column with a surface mixed layer of 50 m. Red line = phytoplankton respiration rate. Black line = Phytoplankton photosynthesis for the initial assumption of constant values to the compensation depth of 10 m. Blue line = Phytoplankton photosynthesis assuming a linear decrease from the surface to the compensation depth. Green line = Phytoplankton photosynthesis assuming a near‐surface layer of light saturation followed by linear decrease to the compensation depth. Yellow numbered circles are used in the text to discuss the calculations