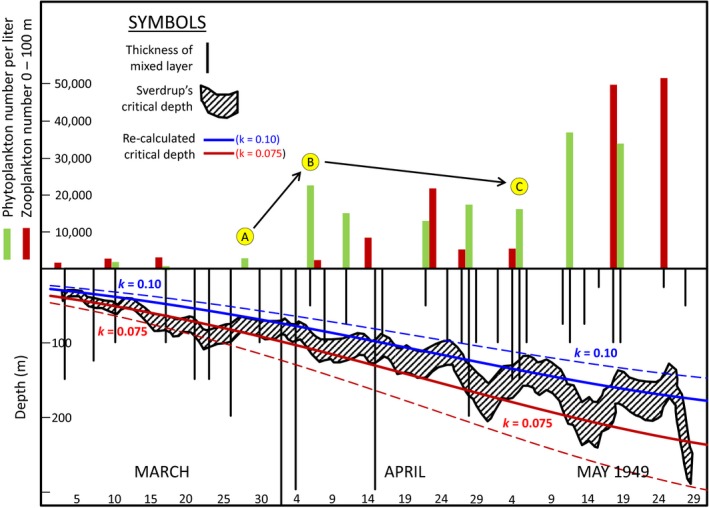
Figure 3.

“Digital age” reproduction of figure 2 of Sverdrup (1953). Top half of figure shows phytoplankton (green bars) and zooplankton (red bars) abundances observed between March and May 1949 at Weather Station “M.” Bottom half of figure shows mixed layer depths (vertical black lines) and the range of Sverdrup's critical depth estimates (hatched area) for diffuse attenuation coefficients (k) of 0.10 and 0.075 m−1. Using these values for k and assuming constant cloudiness values following Sverdrup's scale, our recalculated critical depth values are shown by the solid red (k = 0.075 m−1; cloudiness = 7.5) and blue lines (k = 0.10 m−1; cloudiness = 7.5) and dashed red (k = 0.075 m−1; cloudiness = 6.0) and blue lines (k = 0.10 m−1; cloudiness = 8.5). For these calculations, we assumed a constant respiration rate of 0.14 g cal cm−2 hr−1, which is the average of two values given by Sverdrup for the studies of Jenkins (1937; 0.13 g cal cm−2 hr−1) and Pettersson, Höglund, and Landberg (1934; 0.15 g cal cm−2 hr−1)
