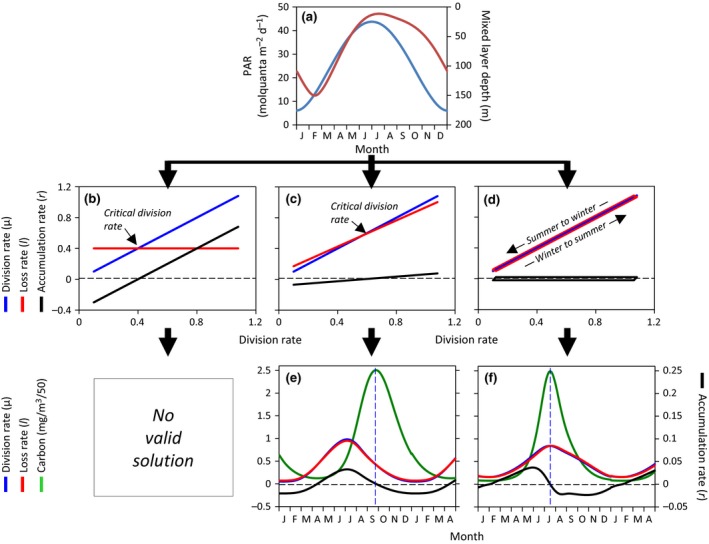
Figure 5.

Illustration of contrasting bloom hypotheses. (a) Annual cycles in (blue line) incident photosynthetically active radiation (PAR) and (red line) mixed layer depth representative of a high latitude, open ocean bloom forming region. (b–d) Phytoplankton division, loss, and accumulation rates plotted as a function of division rate for contrasting bloom concepts. (b) Critical Division Rate Hypothesis where loss rates are assumed constant. Note that there are no parameterizations of this concept that yield valid annual cycles in phytoplankton biomass when applied to the PAR and MLD data in panel (a). (c) Critical Division Rate Hypothesis where loss rates are assumed to covary with division rates, but a threshold exists (black arrow) that must be surpassed for phytoplankton biomass to increase. Accordingly, biomass decreases at all division rates below this threshold. (d) Conceptual model of plankton ecosystems where changes in phytoplankton loss rates are temporally lagged behind changes in division rate. (e, f) Phytoplankton carbon concentrations and division, loss, and accumulation rates associated with the conceptual relationships shown in (c) and (d), respectively, when applied to the annual cycles in PAR and MLD shown in panel (a). Note x‐axis extends for 16 months. For these calculations, division rate was assumed to be a linear function of median mixed layer PAR. Horizontal dashed black line in (b)–(f) corresponds to a biomass accumulation rate = 0. Vertical dashed blue line in (e) and (f) corresponds to the climax in biomass and provides a reference against which maxima in the three biologic rates can be compared. See Appendix S1 for mathematical formulation for the three scenarios shown panels b, c, and d
