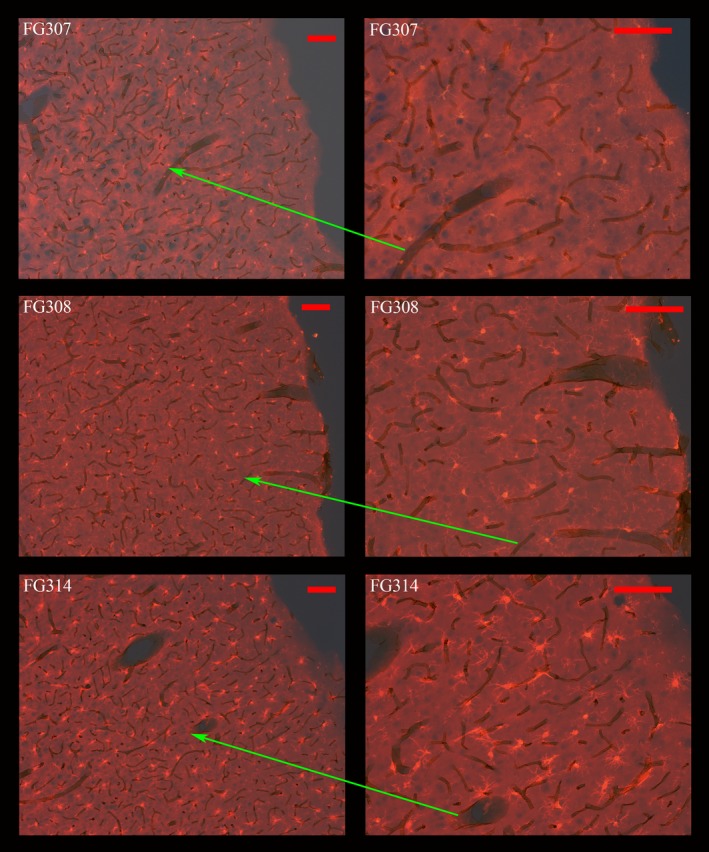
Figure 3.

Co‐localization of activated microglia and vasculature in the parietal cortex. The photomicrographs panels were formed by merging the visible light images with the fluorescent images of sections dual labeled with 3,3'‐diaminobenzidine (DAB)‐RECA1 antibody and TRITC‐Iba1‐antibody. Bright red TRITC labeled microglia in layers I through III can be seen in a Saline animal (FG307) at two magnifications (top two panels). In the middle two panels, slightly larger microglia can be seen in the same cortical regions in an animal from the CORT group (FG308). Finally, in the bottom two panels, activated microglia in an animal from the METH+Glucose group (FG314) can be seen from cortical layer III all the way into the lower portions of layer I. The ends of the red arrows identify the identical region at higher magnification. Magnification bar = 100 μm.
