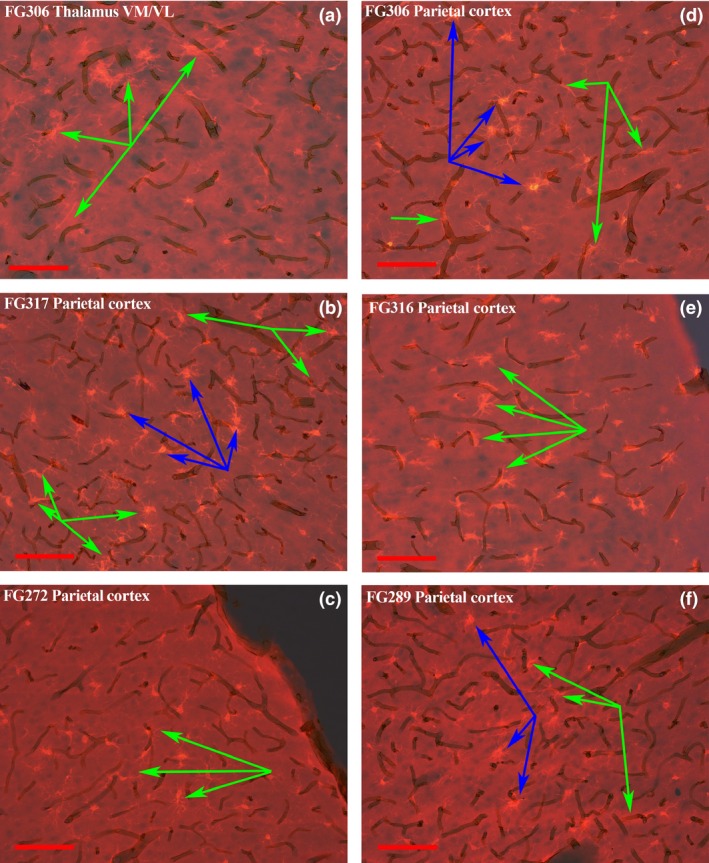
Figure 4.

Co‐localization of activated microglia and vasculature in the parietal cortex after METH+CORT. The photomicrographs panels were formed in the same manner as those in Fig. 3. Activated microglia associated with vasculature, identified by the green arrows, are present at the border of the ventrolateral and ventromedial thalamus in panel (a). This panel was from a micrograph of an animal from the METH+CORT group, as are all the other panels in this figure. The micrographs in panels (b) through (f) show activated microglia, identified by the blue arrows, in association with vasculature in layers II and IV of the parietal cortex in regions where there is minimal or no FJc labeling/neurodegeneration. Magnification bar = 100 μm.
