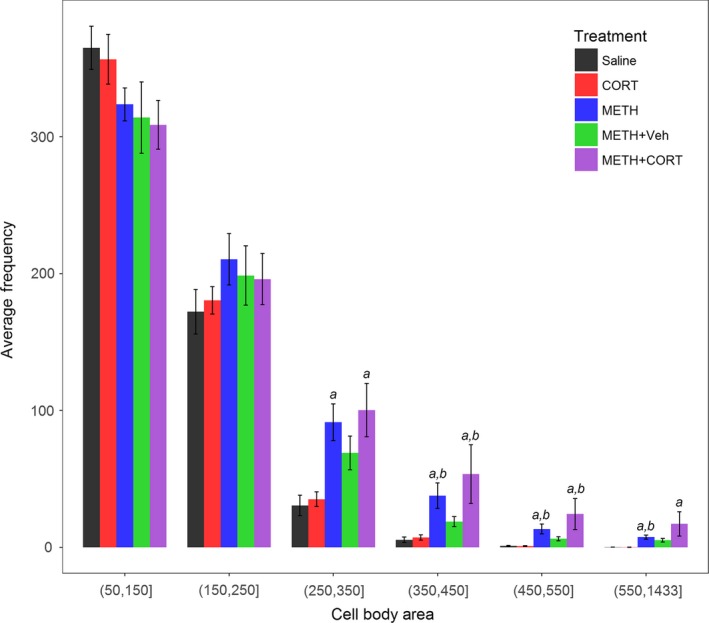
Figure 5.

Bar plot of microglia in the parietal cortex after treatment. Average number and SEM of microglia categorized by microglial area (soma + adjoining proximal processes) in Saline, CORT, METH, METH+Veh and METH+CORT treatment groups. anumbers significantly greater than Saline at p < 0.05 as adjusted for multiple comparisons. bnumbers significantly greater than CORT at p < 0.05 as adjusted for multiple comparisons.
