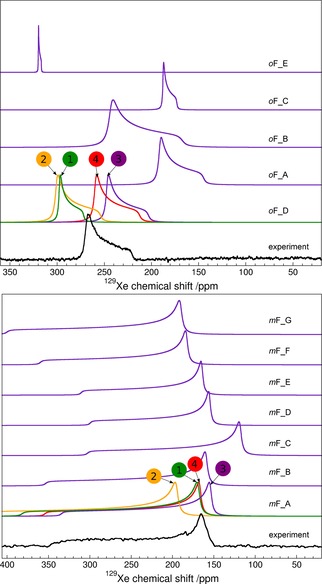
Figure 2.

Experimental (black) and calculated (indigo) 129Xe NMR powder spectra of o‐fluorophenol (top) and m‐fluorophenol (bottom) with 129Xe gas reference at zero. Calculated spectra for all structures were obtained from BHandHLYP‐scaled periodic PBE NMR parameters at PBE‐TS optimized geometry (method/structure=BHandHLYP/PBE‐TS). For the most probable candidates, oF_D and mF_A, results from different periodic modeling levels are displayed: (1, green) PBE/CSP, (2, orange) PBE/PBE‐TS, (3, indigo) BHandHLYP/PBE‐TS and (4, red) BHandHLYP/PBE‐TS with effects due to Xe dynamics at T=300 K (see text for details).
