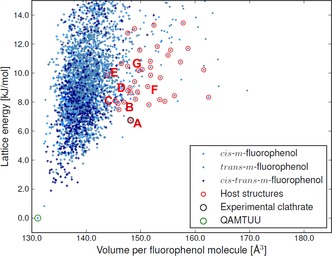
Figure 4.

The crystal energy landscape of m‐fluorophenol. Each point represents one crystal structure and is colored according to the molecular conformation (cis‐trans‐m‐fluorophenol refers to Z′=2 structures containing both conformers). Structures with a lattice energy within 13 kJ mol−1 from the lowest energy structure and having cavities of suitable size for xenon absorption (see text) are encircled in red. The experimentally known stable polymorph (CSD refcode QAMTUU) is encircled in green. The labels A–G correspond to structures mF_A to mF_G in the text.
