
Figure 2.
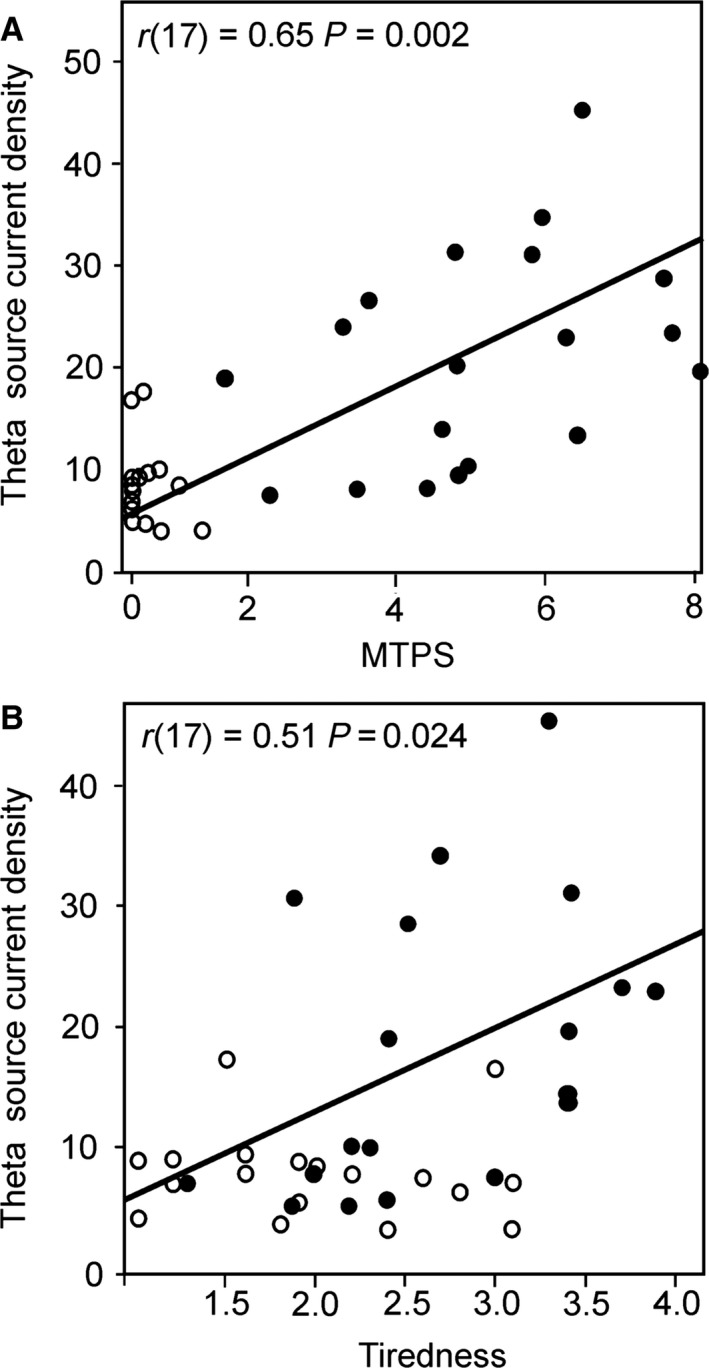
(A) Scatterplot illustrating the significant correlation between theta oscillatory band activity in frontal cortices (from cluster which demonstrated a significant difference in patients relative to healthy group) and MTPS pain scores from the day of testing in the FM patient group (solid circles) and healthy participants (transparent circles), and (B) Correlation between theta oscillatory activity and AD‐ACL tiredness scores.