
Figure 1.
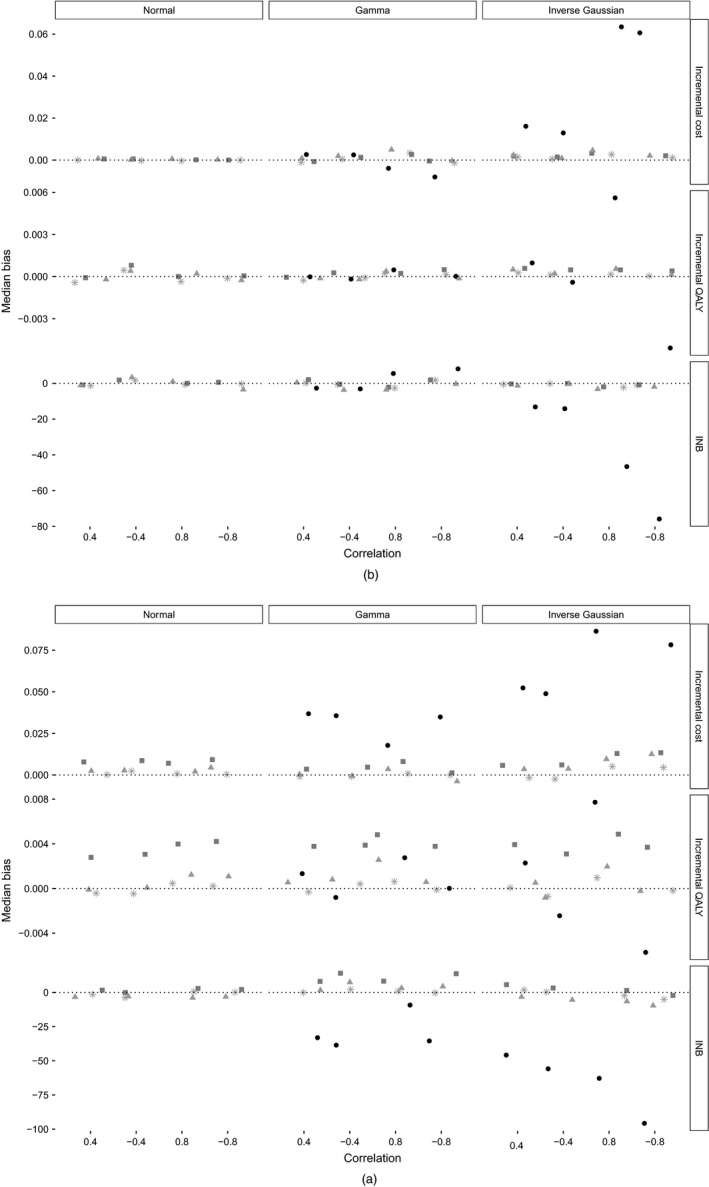
Median bias for scenarios with 30% non‐compliance and sample sizes of (a) n=100 and (b) n=1000 (results are stratified by cost distribution, and correlation between cost and QALYs; results for two‐stage least squares (not plotted) are identical to those for three‐stage least squares; model uBGN was not applied to normal cost data):  , zero bias;
  , three‐stage least squares;
  , BFL;
  , uBN;
  , uBGN