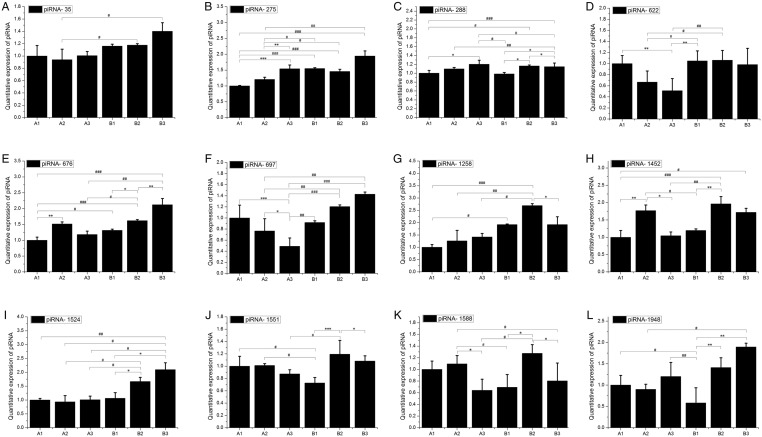
Figure 4.
qPCR analysis of piRNAs. qPCR quantitative expression analysis of 14 genic-transcript-linked piRNAs that were upregulated in group B, along with their linked coding genes. cDNA templates used for the amplification of piRNAs and genes were prepared separately, and amplified with appropriate piRNA and gene-specific primers. The expression of piRNAs and genes were normalized against the levels of snoRNA and U6, respectively. (A, B, C, D, E, F, G, H, I, J, K and L) Represents piRNA (35, 275, 288, 622, 676, 697, 1258, 1452, 1524, 1551, 1588 and 1948, respectively. Bars indicate the s.e.m. of triplicate analyses. #/*P < 0.05, ##/**P < 0.01 and ###/***P < 0.001.

 This work is licensed under a