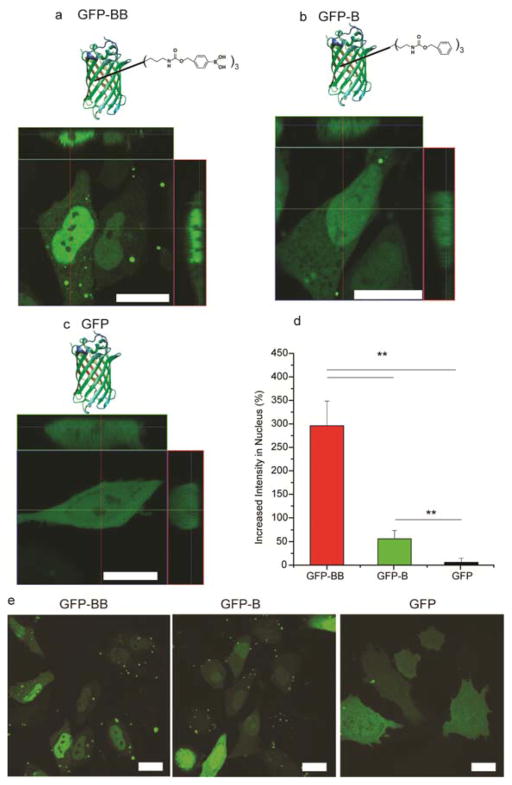
Figure 2.
Nuclear accumulation of eGFP relies on the BB label. (a) LSCM image of a HeLa cell after the delivery of eGFP-BB. (b) LSCM image of a HeLa cell after the delivery of eGFP-B. (c) LSCM image of a HeLa cell after the delivery of normal eGFP. Scale bars: 20 μm. (d) Quantitative analysis of the increased fluorescence intensity of eGFP in the nucleus. Six random cells representing different intensities were analyzed in each group. ** indicates p value of t-test less than 0.01. (e) Large scale LSCM images of HeLa cells after delivery of eGFP with different labels. Native eGFP was delivered as a control. Scale bars: 20 μm.

