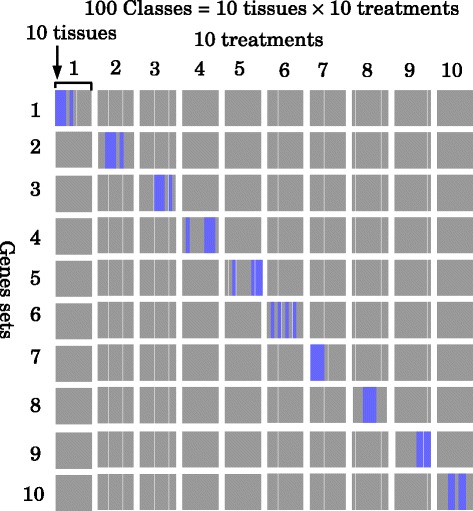
Fig. 1.

The gene expression pattern of 10 gene sets. Each of which includes 100 genes from synthetic data (thus, 1000 of the total of 30,000 genes are being considered). The remaining 29,000 genes do not have any class specificity. Blue squares represent classes where the genes in each gene set are expressive. Ten tissues are assumed to be treated in 10 distinct ways. Thus, in total, there are 100 classes
