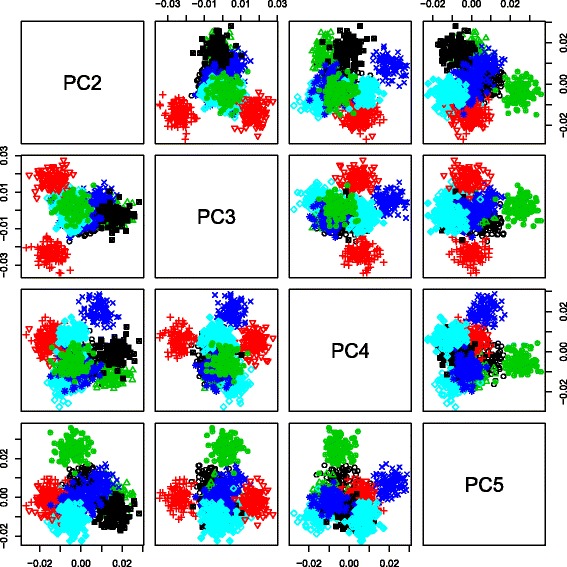
Fig. 2.

Scatter plots involving the second gene’s through fifth gene’s singular value vectors. , of 1,000 genes (1≤i 1≤1000) that belong to one of the 10 gene sets. These 10 gene sets are represented by distinct combinations of colors and symbols. The 29,000 genes not included in any of the 10 gene sets are omitted for clarity
