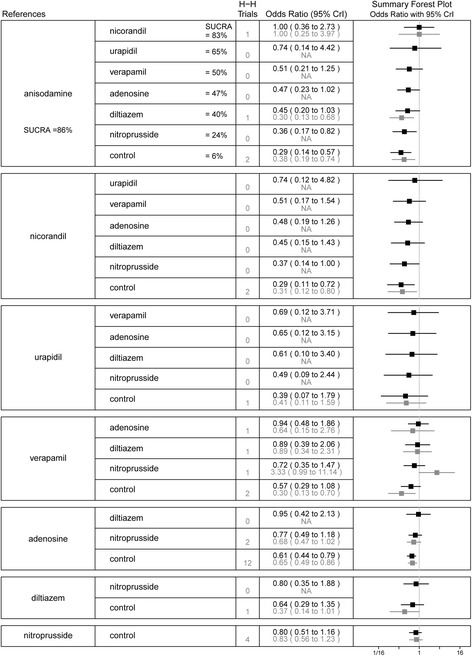
Fig. 4.

Summary forest plot table for the outcome of ST-segment resolution. H-H trials, head-to-head trials; black text, network meta-analysis results; grey text, pairwise meta-analysis results; CrI, credible interval; SUCRA, the surface under the cumulative ranking curve; Interventions are displayed by SUCRA percentages; Each intervention in the second column was compared with the intervention listed in the first column
