
Fig. 3.
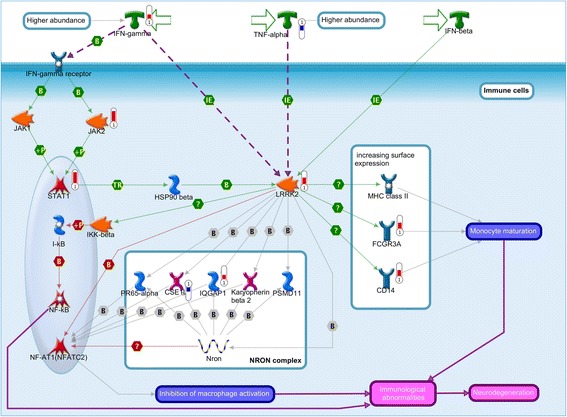
Pathway map for “LRRK2 and immune function in Parkinson’s disease”. Significant up-regulation of genes was denoted as up-pointing bars colored in red, and significant down-regulation of genes was denoted as down-pointing bars colored in blue. The length of the colored bar was proportional to the fold change of the gene in the meta-analysis