
Fig. 5.
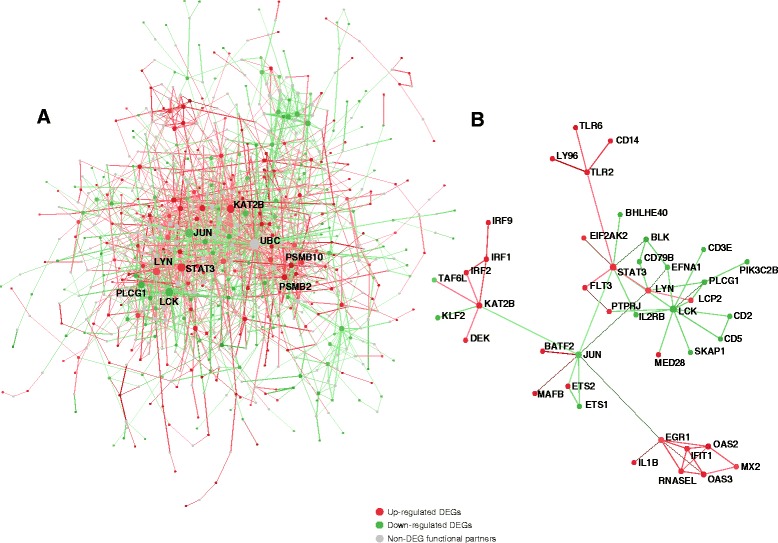
Protein-protein interaction network of the 1655 DEGs in the meta-analysis. a The subnetwork of all DEGs including their functional partners. Each node represents a gene and each edge represents an interaction between two genes supported by experimental evidence. The up-regulated genes were colored in red. The down-regulated genes were colored in green. The non-DEG functional partners were colored in grey. The minimum network mode was chosen for display purposes. b The subnetwork of only DEGs exclusive of their functional partners