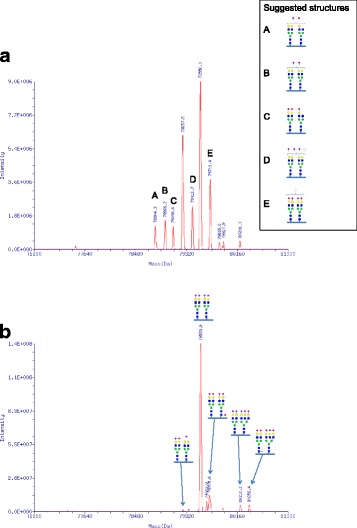
Fig. 2.

Mass spectrometric analysis of transferrin (TF). Patient 3 (a) and control (b) sera were analyzed using LC-MS analysis. Deconvoluted masses of intact serum TF from full scans are shown. TF masses representing confirmed glycoconjugate structures are indicated with respective schematic glycoconjugate structures (blue squares, N-acetylglucosamine; green circles, mannose; yellow circles, galactose; pink diamonds, sialic acid (NeuAc); red triangles, fucose; white circles, hexose) where deviating masses are indicated with letters and suggested structures are shown beside
