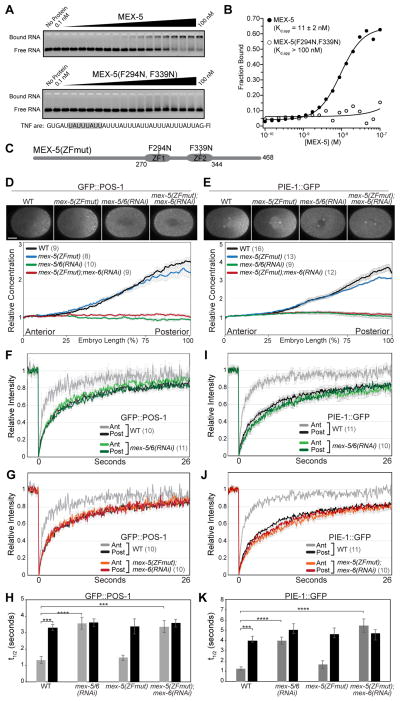
Figure 1. MEX-5 RNA-binding is required for GFP::POS-1 and PIE-1::GFP segregation.
A. EMSA comparing the affinity of MBP-tagged MEX-5(aa236–350) (top) and MBP-tagged MEX-5(aa236–350; F294N, F339N) (bottom) for fluorescein labeled TNF-ARE RNA from the TNFα 3′UTR [10]. The target RNA is shown at the bottom with a MEX-5 binding site highlighted in grey. B. The fraction of bound RNA is plotted as a function of MEX-5 concentration. Kd,app was determined by fitting the data to the Hill equation [10] and is the average of at least three experiments. Error in the key is the standard deviation. Little or no binding of MEX-5(aa236–350; F294N, F339N) was observed at the highest concentration tested (100 nM), so we estimate the Kd,app to be greater than 100 nM. C. Schematic of MEX-5(ZFmut) indicating the position of the TZF RNA-binding domains (ZF1 and ZF2) and the F294N and F339N substitutions. D, E. Top: GFP::POS-1 (D) and PIE-1::GFP (E) localization in the indicated embryos. For this and subsequent figures, images are acquired at NEBD at the cell midplane and embryos are oriented with the anterior to the left and the posterior to the right. Scale bar is 10 μm. Bottom: Relative GFP::POS-1 and PIE-1::GFP concentration along the A/P axis in embryos of the indicated genotype (normalized to the concentration at the anterior end). F–G, I–J. Mean FRAP recovery curves for GFP::POS-1 (F and G) and PIE-1::GFP (I and J) in the anterior and posterior of embryos of the indicated genotype. The same WT data are presented in the top and bottom graphs (error bars are only shown in the top graph for visual clarity). Photobleaching was performed at time = 0. H, K. Mean half-time of recovery (t1/2) for the indicated FRAP experiments. A = Anterior, P = Posterior. In this and subsequent figures, p values are: * <0.05; ** <0.01; *** <0.001; **** <0.0001; n.s. = not significant (>0.05). For all graphs, error bars represent SEM and the number of embryos analyzed are in parentheses. Throughout this figure, WT embryos were treated with a control RNAi (empty L4440 vector). See also Figure S1, S2 and Table S1.

