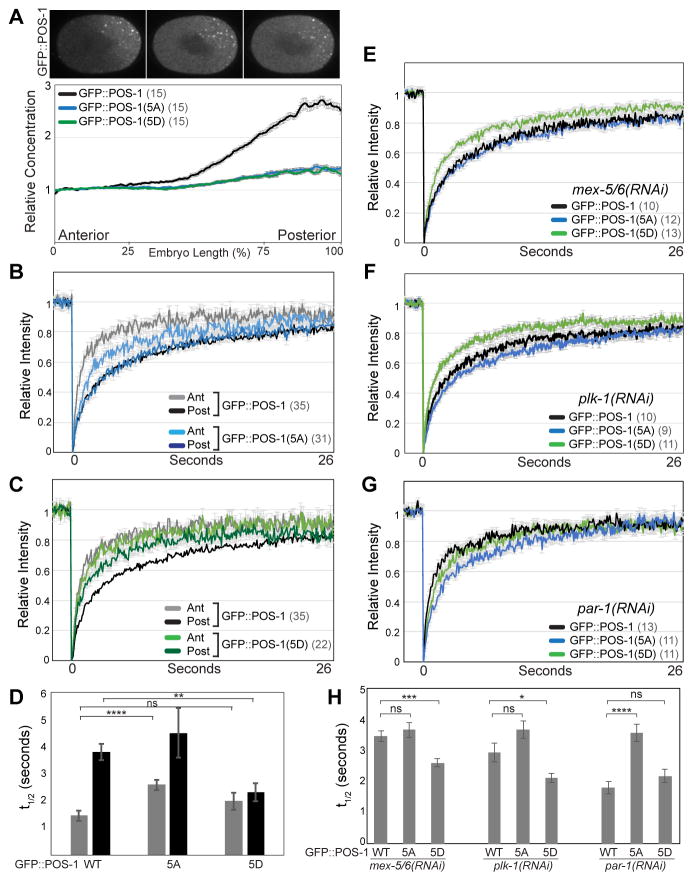
Figure 4. PLK-1 phosphorylation controls POS-1 mobility.
A. Top: Images of embryos expressing the indicated GFP::POS-1 alleles. Bottom: relative concentration of the indicated GFP::POS-1 alleles along the A/P axis. B, C. FRAP recovery curves for the indicated GFP::POS-1 alleles. D, H. Mean t1/2 for the indicated FRAP experiments. E–G. FRAP recovery curves for the indicated GFP::POS-1 alleles in mex-5/6(RNAi), plk-1(RNAi) and par-1(RNAi) embryos. As with all other FRAP experiments in this study, FRAP was performed simultaneously in the anterior and posterior cytoplasm. Because GFP::POS-1 mobility is uniform in mex-5/6(RNAi), plk-1(RNAi) and in par-1(RNAi) embryos, the anterior and posterior recovery curves for each genotype were averaged together. See also Figure S3 and Table S1.

