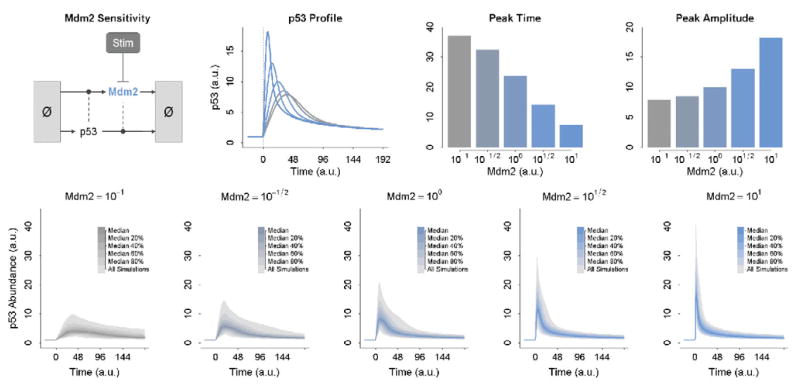
Fig. 3.
The effect of the steady-state abundance of Mdm2 on the dynamic response of p53 to stimulation. At top, the steady-state abundance of Mdm2 is varied from 0.1 (light gray) to 10 (dark gray). The result of this variation on the time and amplitude of the p53 response are shown as bar graphs on the right. At bottom, Mdm2 is again varied from 0.1 to 10. Each of the five panels represents a distinct but constant abundance of Mdm2. The abundance of p53 is always 1. The rates of p53 and Mdm2 synthesis and degradation are then allowed to take a random value from a uniform distribution over 0.1 to 10 times their nominal wildtype values. The p53 response to perturbation is simulated for 1000 samples in each panel and the median dynamics plotted. (For color version of this figure, the reader is referred to the web version of this book.)

