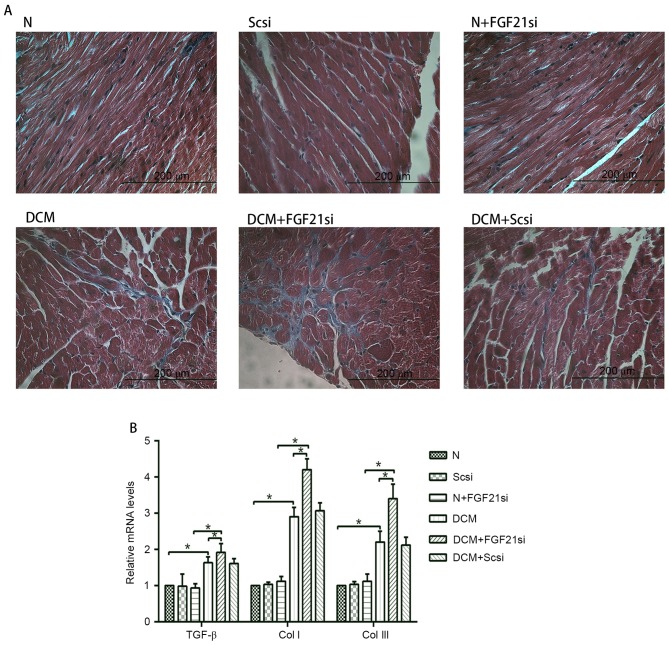
Figure 3.
Cardiac fibrosis and expression levels of TGF-β, Col I and Col III. (A) Masson's trichrome staining was performed in cardiac tissues (magnification, ×400; scale bar, 200 µm). (B) Relative mRNA expression levels of fibrosis-associated factors, including TGF-β, Col I and Col III. *P<0.05. TGF-β, transforming growth factor-β; Col, collagen; FGF21, fibroblast growth factor 21; N, normal; DCM, diabetic cardiomyopathy; Scsi, scrambled siRNA; FGF21si, FGF21 siRNA.

