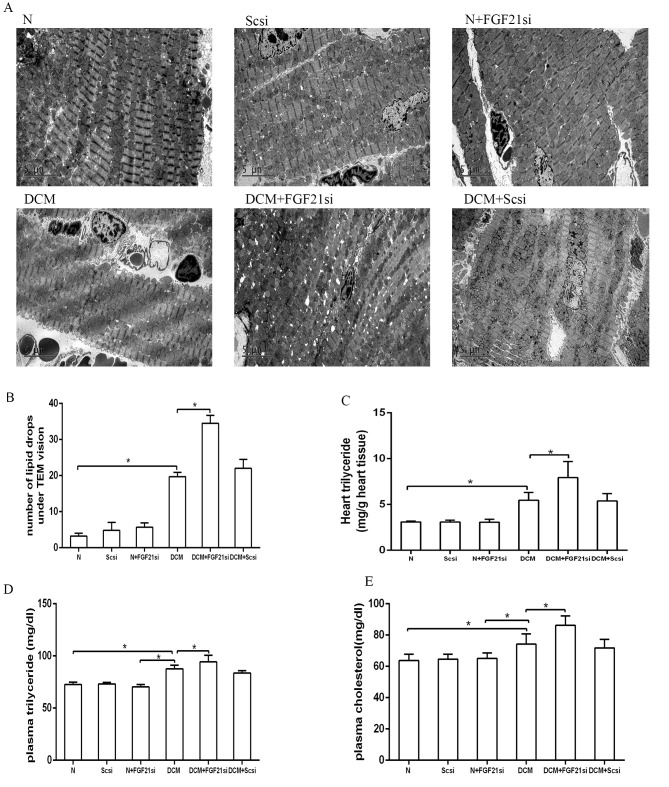
Figure 4.
Quantification of lipid droplets, as well as heart triglyceride, plasma triglyceride and cholesterol concentrations in the different groups. (A) Lipid droplets observed by examination under a transmission electron microscope. Magnification, ×4,200. (B) Quantitative analysis of lipid droplets. Analysis of (C) heart triglyceride, (D) plasma triglyceride and (E) plasma cholesterol levels. *P<0.05. FGF21, fibroblast growth factor 21; N, normal; DCM, diabetic cardiomyopathy; Scsi, scrambled siRNA; FGF21si, FGF21 siRNA.

