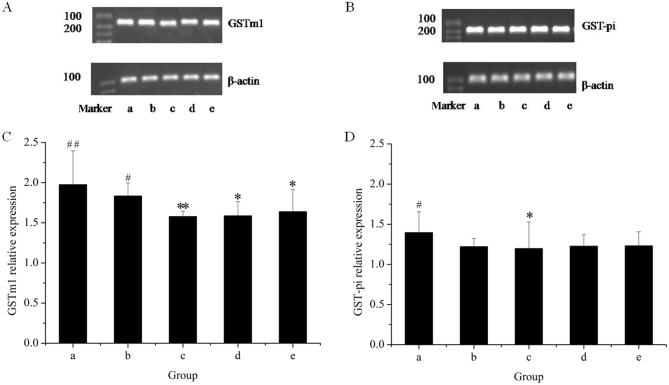
Figure 5.
Reverse-transcription quantitative polymerase chain reaction analysis of hepatic GST using amplimers of GSTm1 and GST-pi. Gels displaying bands for (A) GSTm1 and (B) GST-pi. Quantification of (C) the GSTm1/β-actin ratio and (D) the GST-pi/β-actin ratio. Lanes: a, control group; b, GE and aqueous extract of Ramulus et Folium Mussaendae pubescentis combination group; c, high-dose GE group; d, medium-dose GE group; e, low-dose GE group. *P<0.05, **P<0.01 vs. control; #P<0.05, ##P<0.01 vs. high-dose GE group. GE, Herba Gelsemii elegantis dichloromethane extract; GSTm1, glutathione S-transferase mu 1.

