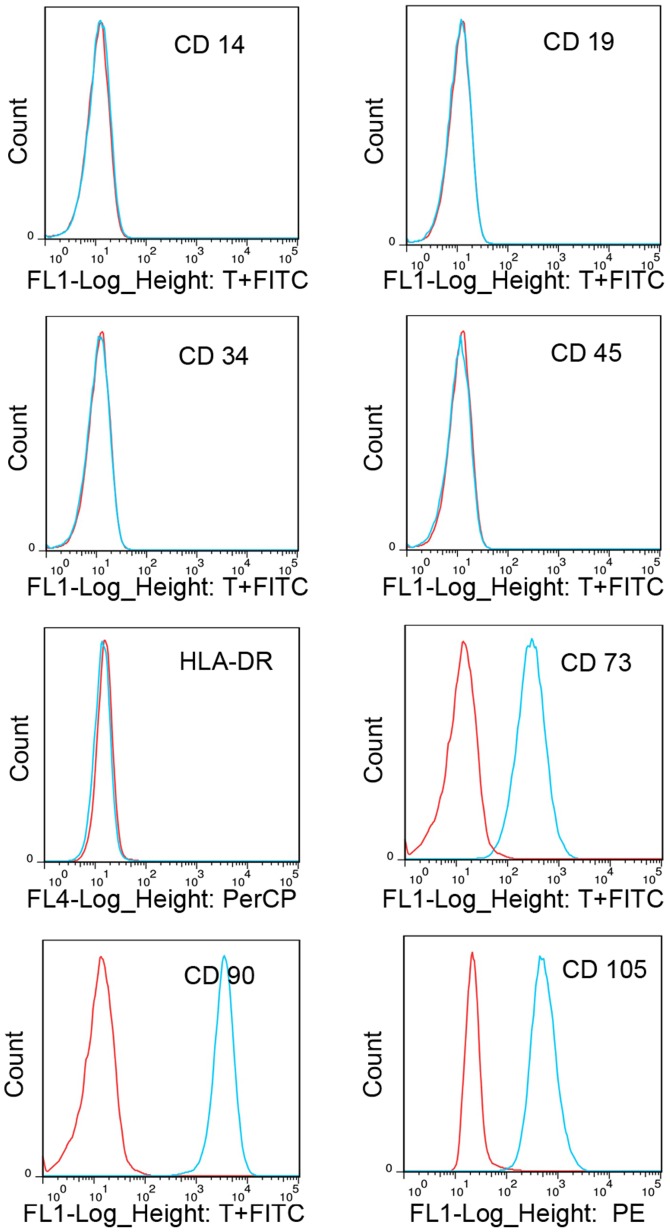
Figure 1.
Immunophenotypic profile of cultured cartilage endplate-derived stem cells. The blue lines represent the fluorescence intensity of cells stained with the indicated antibodies and the red lines represent the negative controls cells, which were stained with a non-immunoreactive isotype control antibody. FITC, fluorescein isothiocyanate; PerCP, peridinin chlorophyll; PE, phycoerythrin; HLA-DR, human leukocyte antigen-antigen D related.

