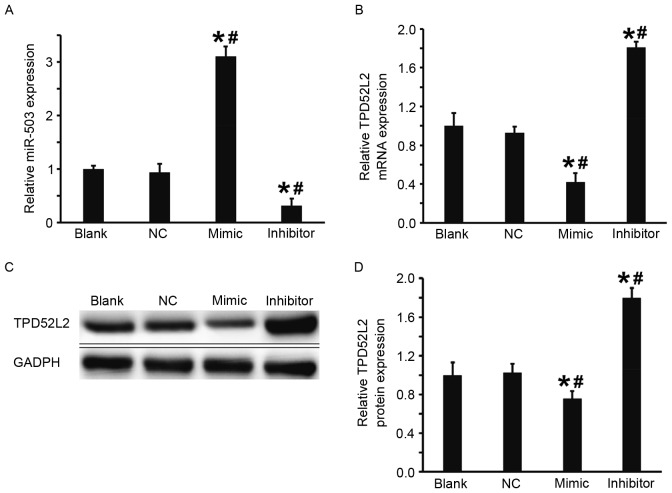
Figure 3.
Effect of miR-503 on the expression of TPD52L2 in DU145 cells. (A) Expression of miR-503 in the DU145 cells of blank, NC, mimic and inhibitor groups. (B) Relative expression of TPD52L2 mRNA in DU145 cells of the blank, NC, mimic and inhibitor groups. (C-D) Relative expression of TPD52L2 protein in DU145 cells of blank, NC, mimic and inhibitor groups. Reverse transcription-quantitative polymerase chain reaction was used to determine the expression of miR-503 and TPD52L2 mRNA and western blot analysis was used to measure TPD52L2 protein expression. *P<0.05 vs. blank group; #P<0.05 vs. NC group. miR-503, microRNA-503; NC, negative control; TPD52L2, tumor protein D52 like 2.

