Figure 5.

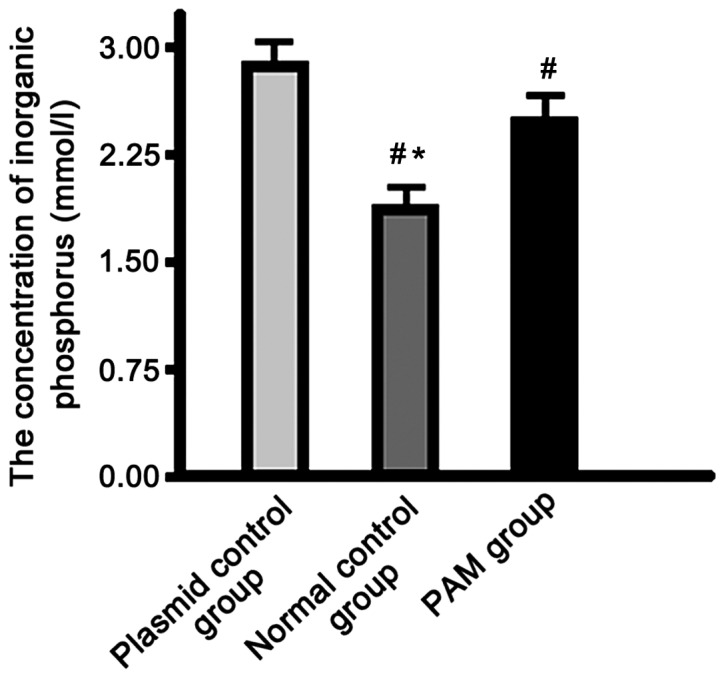
Determination of inorganic phosphorus concentration in culture supernatant. #P<0.05 when compared to the plasmid control group. *P<0.05 when compared to the PAM group.

Determination of inorganic phosphorus concentration in culture supernatant. #P<0.05 when compared to the plasmid control group. *P<0.05 when compared to the PAM group.