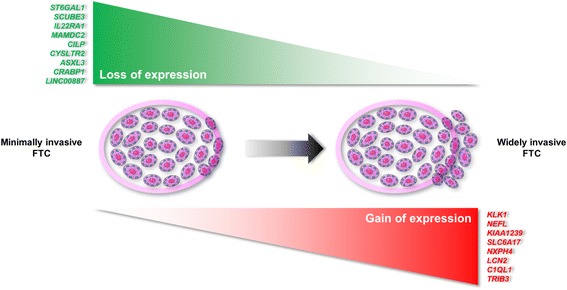
Fig. 1.

Differentially expressed genes found between minimally and widely invasive follicular thyroid carcinoma (FTC). Gene expression was measured by high-throughput paired-end RNA sequencing and using statistically significant values (Q < 0.05). Genes with lower expression in widely invasive FTC as compared with minimally invasive FTC are listed at the top of the figure (green). Genes with higher expression in widely invasive FTC as compared with minimally invasive FTC are listed at the bottom of the figure (red). Details of genes, expression levels, statistical values, and molecular function of the genes are found in Additional file 2: Table S1 for differentially expressed genes and in Additional file 3: Table S2 for differentially expressed transcripts
