Figure 1.
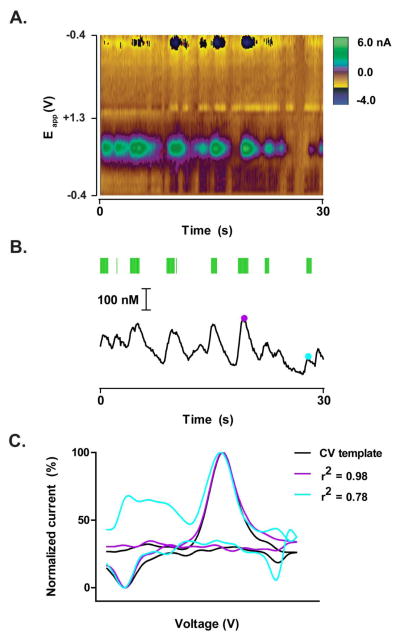
Cocaine evokes phasic dopamine release in the NAc. (A) Representative example of electrochemical data collected from the NAc core. The 30 second example shown here was taken from an intravenous non-contingent cocaine session after 15 infusions. Colorplot depicts changes in current (color) as a function of applied potential (Eapp; y-axis) and time (s; x-axis). Dopamine can be observed based on its oxidation (green feature at ~0.65 V) and reduction (dark blue feature at −0.2 V) currents. (B) Dopamine concentration over time extracted from the colorplot in (A). Conversion of current from the oxidation of dopamine to concentration was made based on a post-recording calibration of the electrode used for data collection. Cyclic voltammograms were considered “CV Matches” for dopamine if they met criteria, r2 value ≥ 0.75 (see data analysis). CV Matches are indicated by the green ticks above the concentration trace. Purple and blue dots are representative times at which the cyclic voltammogram met criteria and therefore considered a CV Match (r2 = 0.98 and 0.78, respectively). (C) Comparison of two cyclic voltammograms taken from the electrochemical data above (purple and blue dots in B) to a cyclic voltammogram template for dopamine. The purple and blue cyclic voltammograms capture the range of cyclic voltammograms that met criteria (CV Matches) in which r2 ≥ 0.75. The black cyclic voltammogram was taken from the dopamine response following electrical stimulation of the VTA before the recording session. Current magnitude of the three cyclic voltammograms were normalized to allow for visual comparison of cyclic voltammogram shape.

