
Figure 2. Comparison of computational methods to account for bias in Hi-C data.
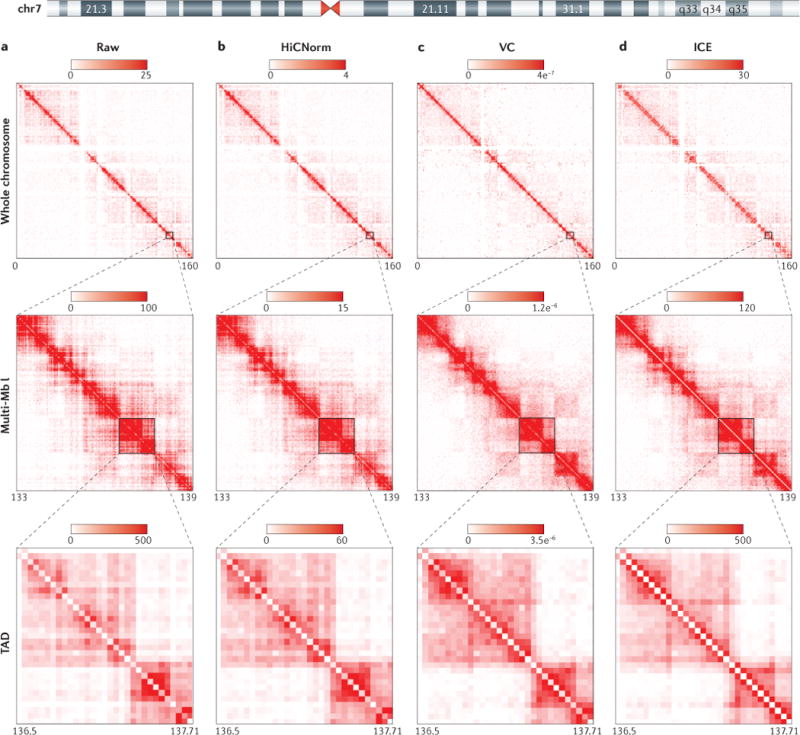
We reprocessed high-resolution Hi-C data from IMR90 cells19 uniformly until the bias-removal step, at which point either raw contact matrices were generated or normalization was conducted with one of three methods. Here, we illustrate a semi-quantitative comparison of human chromosome 7 (chr7) for 3 genomic resolutions (whole chromosome, a multi-megabase (multi-Mb) locus and a topologically associating domain (TAD)) at 40 kb bin size for a raw Hi-C contact matrix (part a), an explicit model of bias removal (HiCNorm) (part b), and two methods of matrix-balancing algorithms for bias removal, namely a fast, rough, single-iteration balancing method, vanilla coverage (VC) (part c) and iterative correction and eigenvector decomposition (ICE) (part d). It can be visually appreciated that the explicit or implicit assumptions made by each method to account for biases result in quantitative differences in the normalized interaction frequency between loci. The intensity gradient is a linear increase from zero to the maximum noted (units are observed read counts for the raw matrices, and normalized read counts for the normalized matrix columns). Depicted are a series of symmetrical Hi-C contact matrices at various genomic resolutions. The rows (i) and columns (j) of each matrix represent bins along a chromosome, in this case various regions of human chr7. Each matrix entry [i,j] represents the observed or normalized interaction frequency between a pair of genomic loci. Pairwise interactions observed at higher frequency are depicted as a darker red colour along the colour gradient, whereas light red coloration represents very few observed interactions in the Hi-C data. The gradient units for raw matrices (part a) are ‘observed interaction frequency’ and the units for HiCNorm, VC and ICE (parts b–d) are ‘normalized interaction frequency’, which become increasingly apparent when analysing more-local Hi-C contacts (closer to the diagonal). Matrix entries near the matrix diagonal represent pairwise interactions between loci that are proximal in linear genomic distance (i~j), whereas matrix entries far off the diagonal (i≫j) represent pairwise interactions between loci that are very distal in linear genomic distance. For whole-chromosome and TAD resolutions, the maximal signal intensity was set to the ninety-ninth percentile for the given matrix. For the multi-Mb resolution, the maximal intensity was set to the ninety-fifth percentile value of the given matrix. Each matrix is a symmetrical matrix, NxN, and the chromosome coordinate information is given below each matrix in megabases.