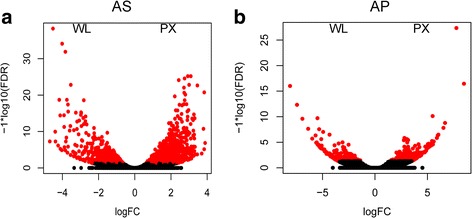
Fig. 2.

Tissue-specific gene expression. Volcano plots displaying the relative expression levels of transcripts upregulated in the pharynx (PX) compared with the whole larva (WL) in a Anisakis simplex (s.s.) (AS) and b Anisakis pegreffii (AP). The x-axis represents the log2 of the expression ratio for each transcript (tissue specific logCPM: whole body counts per million reads, logCPM, CPM); the y-axis represents the log10 of the P-value corrected for the false discovery rate. Red dots represent differentially expressed transcripts with logFDR < 0.05 (at least 2-fold difference in logCPM). Positive logFC values indicate transcripts enhanced in the pharynx subset, while negative values indicate transcripts upregulated in the whole larva
