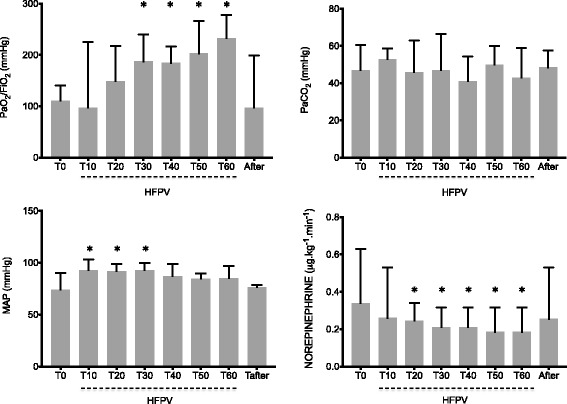
Fig. 1.

Evolution of arterial oxygen tension (PaO2) to inspiratory oxygen fraction (FiO2) ratio and arterial carbon dioxide tension (PaCO2) (upper graphs) and hemodynamic parameters (lower graphs): Mean arterial pressure (MAP) and Norepinephrine doses during the experimental procedure. *P < 0.05 versus time 0 (T0). HFPV high frequency percussive ventilation
