Fig. 3.

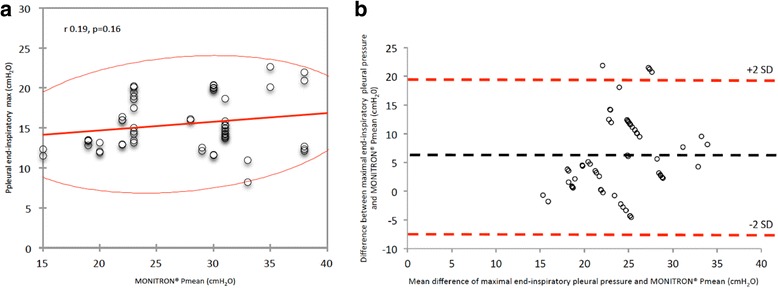
Correlation and Bland and Altman bias between maximal end-inspiratory pleural pressure and high frequency percussive ventilation (HFPV) mean pressures considering all pairs of measurements performed during the study. a N = 58, red line: 95% confidence ellipsis; b N = 58, lines: bias (black dotted) and +2SD/-2SD limits of agreement (red dotted). SD standard deviation
