
Fig. 4.
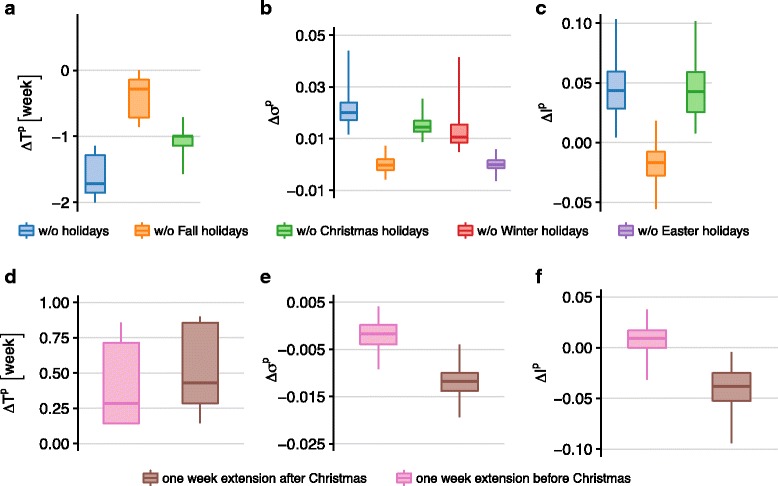
Impact of school holiday periods and holiday extensions. (a)-(b)-(c): Peak time difference, relative variation of epidemic size, and relative variation of peak incidence, respectively, across the following experimental scenarios: w/o Fall holiday model, w/o Christmas holiday model, w/o Winter holiday model, w/o Easter holiday model, w/o holiday model. Boxplots refer to the distributions across patches. (d)-(e)-(f): Peak time difference, relative variation of epidemic size, and relative variation of peak incidence, respectively, for the Christmas holiday extension models, before or after the break. Boxplots refer to the distributions across patches