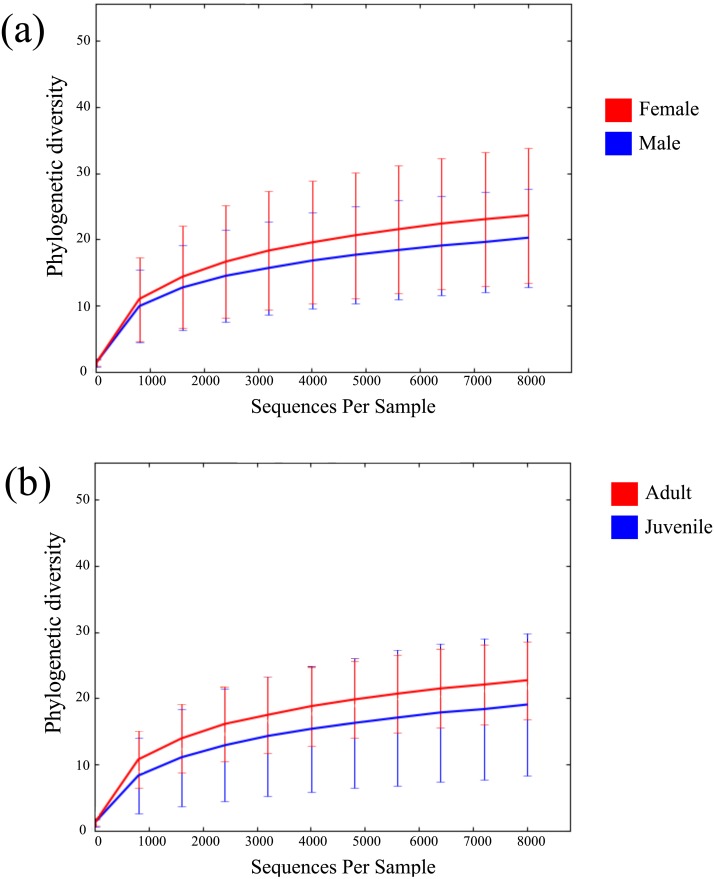
Figure 1. Rarefaction curves of bat microbiomes.
Read data was rarefied to 8,000 OTUs, and measured using phylogenetic diversity. (A) The alpha diversity of bat samples were clustered based on gender to investigate differences in bacterial abundance between males and female. (B) Reads were clustered based on age datasets, with age dataset 2 displayed (0 yrs considered juvenile, ≥1 yr considered adult).

