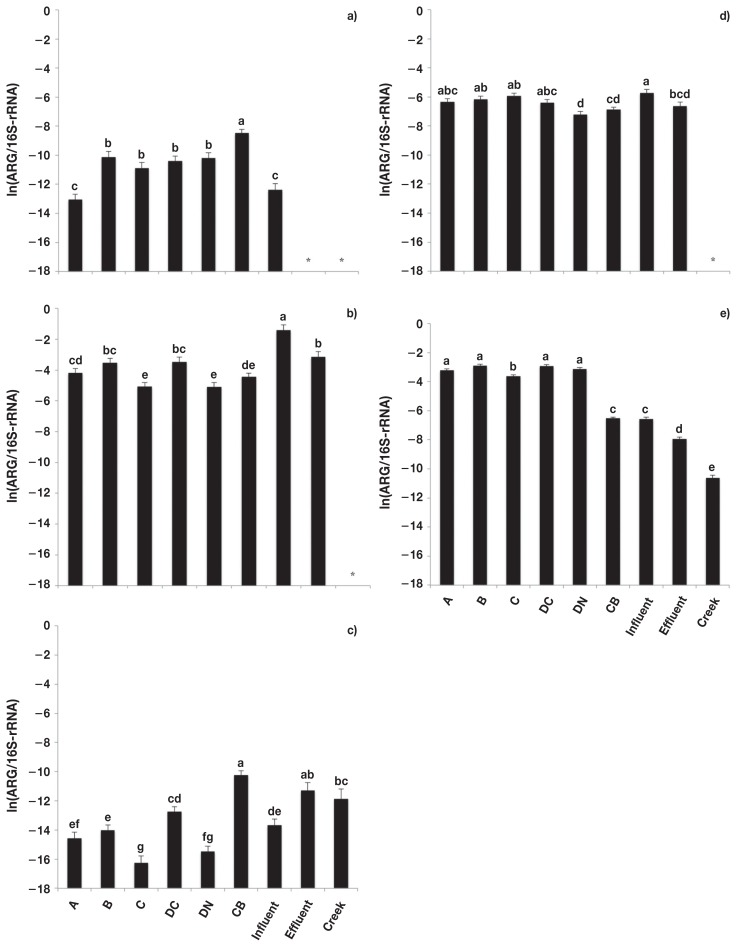
Figure 3.
Relative abundance [copies of antimicrobial resistance genes (ARG)/copies of 16S-rRNA] of macrolide resistance genes. a) erm(A), b) erm(B), c) erm(C), d) erm(F), and e) mef(A). Error bars represent standard deviation of the mean. A — feedlot A, B — feedlot B, C — feedlot C, DC — feedlot D (conventional production), DN — feedlot D (natural production), CB — catch basin, Influent — sewage influent, Effluent — sewage effluent, and Creek — Ephemeral creek.
a,b,c,d,e,f,g Different letters represent significant difference (P ≤ 0.05).
* Unable to be detected/outside of standard curve.

