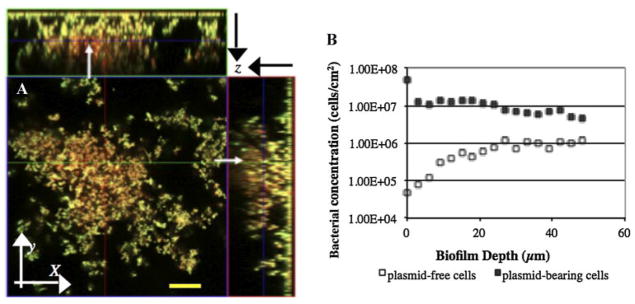
Figure 3.
A: In situ monitoring of plasmid segregational loss in a biofilm cultivated at 30°C. Spatial distribution of yellow fluorescent donor cells (P. putida TUM-PP12 [miniTn5Putdsred] harboring the TOL plasmid [pWWO::gfpmut3b]) and red fluorescent segregants (P. putida TUM-PP12 [miniTn5Putdsred]). The micrograph is displayed in an orthogonal view to show the biofilm structure in three sets of two-dimensional sections; XY, XZ, and YZ. The stack image was collected on Day 4 of continuous biofilm formation. This single image slice was acquired at an axial position in the flow cell approximately 1.9 cm from the inlet in the center of the flow cell; overall biofilm thickness was 70 μm. The arrows indicate the red fluorescent segregants embedded in microcolonies. Bar size: 20 μm. B: Distribution of both plasmid-bearing (■) (P. putida TUM-PP12 [miniTn5Putdsred] harboring the TOL plasmid [pWWO::gfpmut3b]) and plasmid-free (□) (P. putida TUM-PP12 [miniTn5Putdsred]) cells at the different biofilm depths sampled on Day 4 in a continuous flow chamber.

