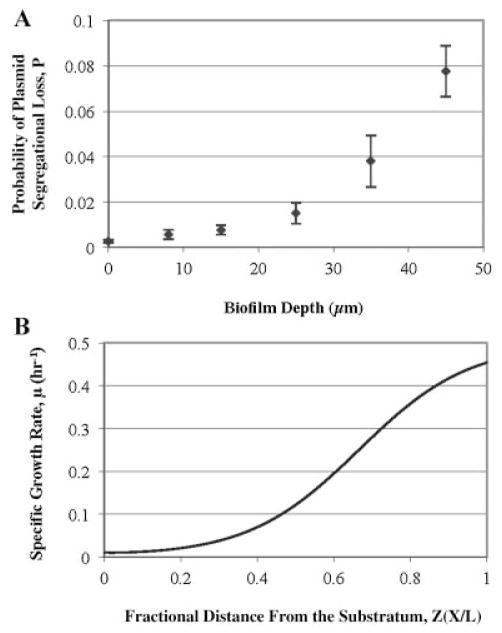
Figure 4.
Probability of plasmid segregational loss (A) and predicted specific growth rate (B) as a function of biofilm depth. Biofilm depth in figure (B) was normalized to a fractional distance from the substratum. Biofilms were cultivated for 7 days within a continuous parallel flow cell at 30°C. Each data point was calculated by using a mathematical model (SI).

