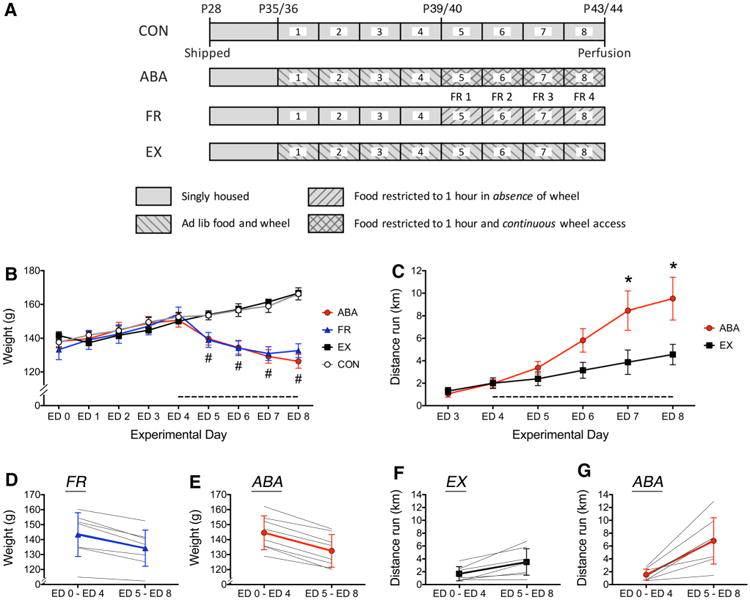
Fig. 1.

Body weight and wheel activity of CON, ABA, FR, and EX groups. a Timeline of the environmental conditions of the four experimental groups. Animals were food restricted (FR), given ad libitum access to a running wheel to allow for voluntary exercise (EX), induced to undergo activity-based anorexia (ABA) by combining wheel access and food restriction (ABA), or served as controls (CON) that neither exercised nor were food restricted. All animals were shipped to NYU's animal facility at postnatal day (P) 28. Wheel access for the ABA and the EX group began on experimental day 1 when animals were P35 or 36. Food restriction for the ABA and the FR groups began on experimental day 1 (FR1), which corresponded to the fifth experimental day when animals were P39 or 40. All animals were euthanized by transcardial perfusion under anesthesia on P43/44. b Body weights of all groups are shown from ED1 through ED8, as mean ± SEM. Hash indicates a main effect of food restriction with p < 0.05. There was no significant interaction between the effect of food restriction and wheel access. The dashed line along the x-axis indicates the food-restricted period, beginning on ED4. c Average voluntary running wheel activity is displayed for the EX and ABA groups for the last 6 of the 8 days of wheel access. Asterisk indicates significant difference between EX and ABA at p < 0.05. d, e Average weight of the FR and ABA groups across the first four experimental days (ED1 through ED4) is compared to the average weight across the last four food-restricted days (ED5 through ED8). Each gray line represents data from a single animal, while the heavier line represents the group average as mean ± SD. f, g The average running activity per 24 h during the first 4 days of wheel access was compared to the average activity during the last 4 days of wheel access in the EX and the ABA groups. Each gray line represents a single subject, while the heavier lines represent the group average as mean ± SD. In the ABA group, the latter 4 days of wheel access were accompanied by food restriction. 1 wheel count equaled 0.64 m
