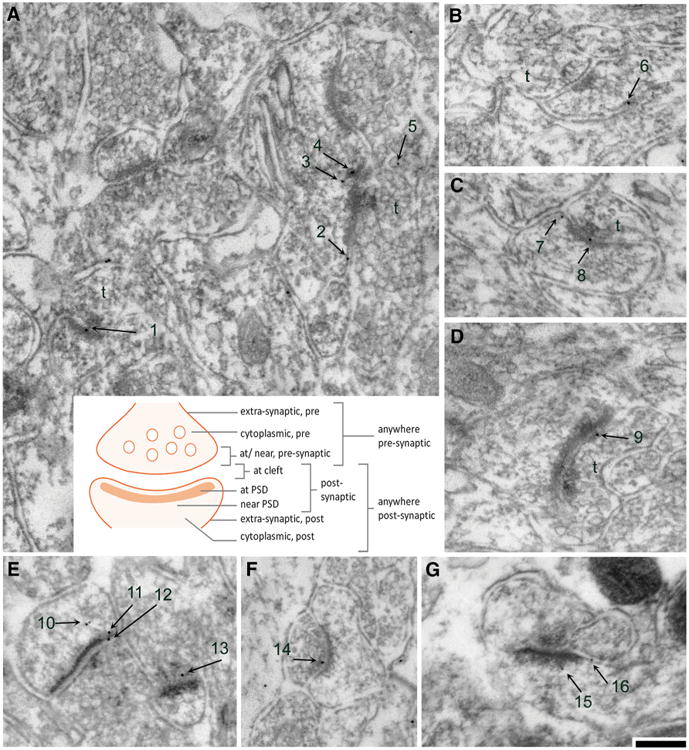
Fig. 2.

Categorization of subcellular sites in the vicinity of axo-spinous asymmetric synapses where NR2A and NR2B immunoreactivities were observed. a through e are examples of electron micrographs taken from tissue immunolabeled for the NR2A subunits, while f, g are examples of micrographs taken from tissue immunolabeled for the NR2B subunits. a–d, f are micrographs taken from EX tissue, while e, g were taken from ABA tissue. The numbers depict PEG particles associated with axo-spinous asymmetric synapses. The presynaptic sides are indicated by t for axon terminal. Calibration bar is equal to 200 nm and applies to all panels. The cartoon in the center describes the categorization of subcellular location of PEG particles. The subcellular position for each particle in these examples were categorized as follows: 1 at PSD; 2 at extra-synaptic spine plasma membrane, 3 and 4 near PSD, 5 as cytoplasmic on the presynaptic side, 6 and 7 at extra-synaptic spine plasma membrane, 8 at cleft, 9 at/near presynaptic plasma membrane, 10 (two particles) as cytoplasmic within the postsynaptic spine, 11 near PSD, 12 at cleft, 13 at/near presynaptic axon terminal, 14 at/near presynaptic plasma membrane, 15 near PSD, and 16 at extra-synaptic spine plasma membrane
