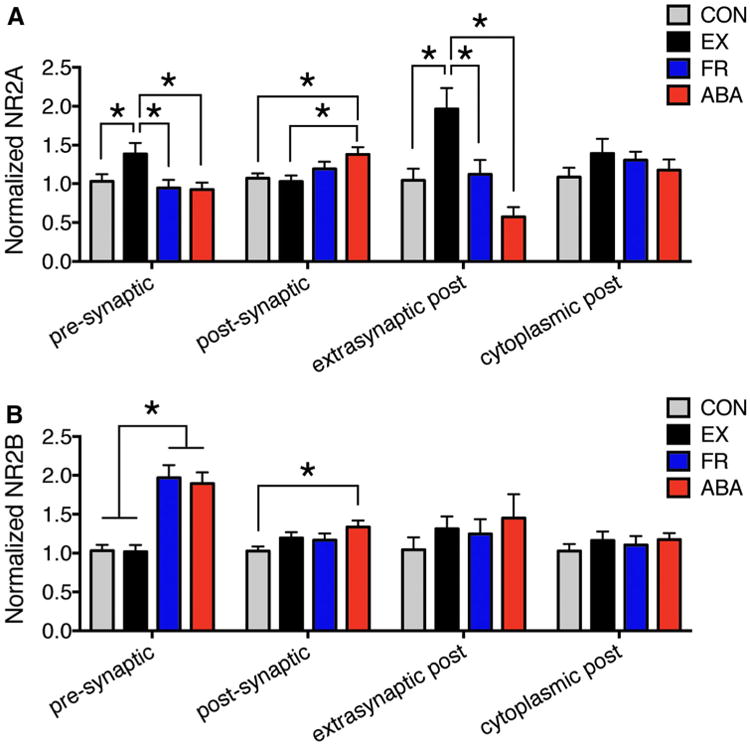
Fig. 3.

ABA elevates both NR2A and NR2B immunoreactivity specifically at the postsynaptic membrane. The histograms depict group comparisons of the number of PEG particles encountered per-10 synapses, at and near axo-spinous junctions, reflecting NR2A (a) and NR2B (b) immunoreactivitynormalized to the average of the CON values. Asterisk depicts significance of difference at p < 0.05 by two-way ANOVA, followed by Fisher's LSD post hoc analysis. The original, pre-normalized CON values for NR2A and NR2B immunoreactivity are shown in Table 2
