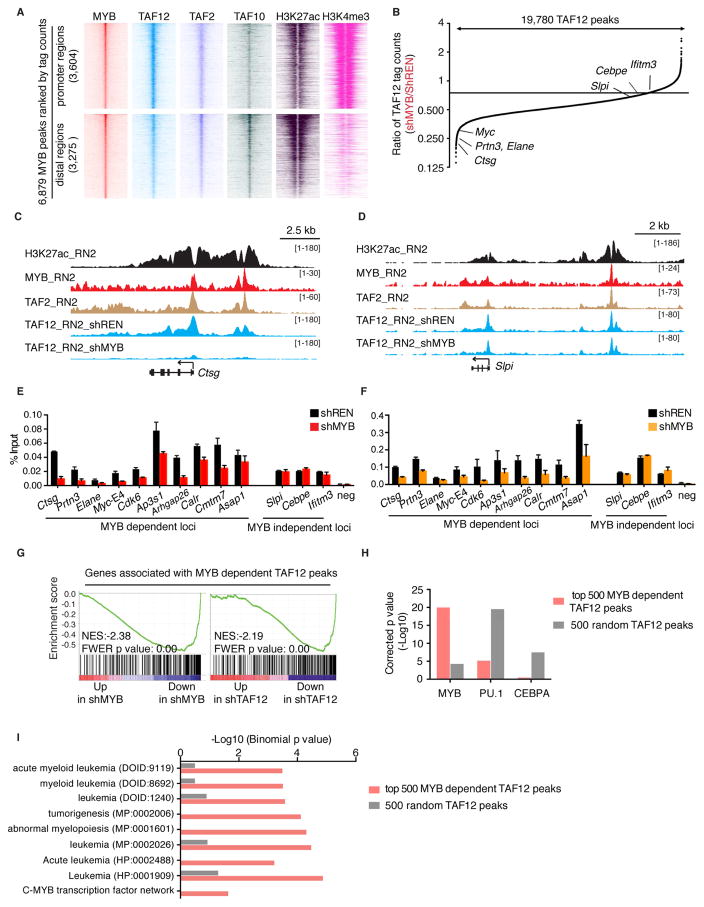
Figure 5. MYB recruits TAF12 to select cis elements in AML cells to support transcriptional activation.
(A) ChIP-seq density plots of MYB, FLAG-TAF12, TAF2, TAF10, H3K27ac and H3K4me3 enrichment at MYB-occupied promoter and distal regions. MYB peaks located within −1 kb to +100 bp of transcription start site were defined as promoter regions, and others were defined as distal regions. Each row represents a 2 kb interval centered on the summit of each MYB peak and were ranked based on MYB ChIP-seq tag counts. FLAG-TAF12 ChIP-seq was performed in RN2 cells stably expressing FLAG tagged TAF12 following 24 hr dox-induced expression of control or MYB (#2652) shRNAs. TAF2 and TAF10 ChIP-seq were performed in parental RN2 cells. MYB, H3K27ac and H3K4me3 ChIP-seq data were from previous studies generated in parental RN2 cells (Roe et al., 2015; Shi et al., 2013).
(B) Global changes in FLAG-TAF12 enrichment following MYB knockdown. Fold-change in TAF12 tag counts for 19,780 TAF12 peaks in shMYB (#2652) versus shREN transduced RN2 cells are ranked and plotted. Examples of MYB dependent and independent peaks are indicated.
(C–D) ChIP-seq profiles of H3K27ac, MYB, TAF2 and FLAG-TAF12 at Ctsg (C), a genomic locus with MYB-dependent TAF12, and Slpi (D), a site with MYB-independent TAF12, in RN2 cells.
(E–F) ChIP-qPCR analysis of TAF12 (E) and TAF2 (F) at indicated MYB dependent and independent TAF12 loci following MYB knockdown. ChIP-qPCR was performed in RN2 cells following 24 hr dox-induced expression of control or MYB (#2652) shRNAs. Bar graphs represent the mean ±3SEM, n=3.
(G) GSEA analysis evaluating the expression of 326 expressed genes (RPMI =5) located nearest to the top 500 MYB-dependent TAF12 peaks following MYB or TAF12 knockdown.
(H) Transcription factor affinity prediction of the top 500 MYB-dependent TAF12 peaks versus 500 random TAF12 peaks. DNA sequences flanking 200 bp of each peak summit were used for motif analysis.
(I) Ontology analysis of genes located nearest to the top 500 MYB-dependent TAF12 peaks versus genes located nearest to 500 random TAF12 peaks using the Genomic Regions Enrichment of Annotations Tool (GREAT). In parentheses is the ontology identifier of each indicated pathway in the GREAT database.
See also Figure S5.

