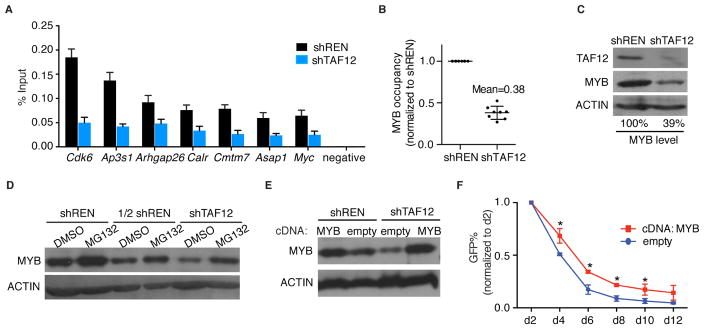
Figure 6. TAF12 protects MYB from proteasome-mediated degradation.
(A) MYB ChIP-qPCR analysis at indicated regions identified via MYB ChIP-seq in RN2 cells infected with control or TAF12 (#364) shRNAs on day 3 post infection. Bar graph represents the mean ±3SEM, n=3.
(B) Quantification of the relative MYB occupancy detected by ChIP-qPCR in (A). Data was normalized to shREN sample. Each dot represents individual locus tested in (A) and the error bar represents SD.
(C) Western blot analysis in RN2 cells infected with control or TAF12 (#364) shRNAs on day 3 post infection. Quantification of MYB bands with normalization to ACTIN bands was performed using ImageJ software.
(D) Western blot analysis of MYB protein level in RN2 cells following dox-regulated shRNA expression for 48 hr, followed by MG132 treatment for 4 hr. 1/2 shREN indicates a 2-fold dilution of shREN sample.
(E) Western blot analysis of MYB protein level in RN2 cells retrovirally co-transduced with the indicated cDNA and shRNA constructs.
(F) GFP depletion assay evaluating the effect of MYB overexpression on the growth-arrest caused by the GFP-linked TAF12 shRNA (#364) in RN2 cells. Data are plotted as the mean ±3SEM. * p<0.05 using unpaired Students’ t-test, n=3.
See also Figure S6.

