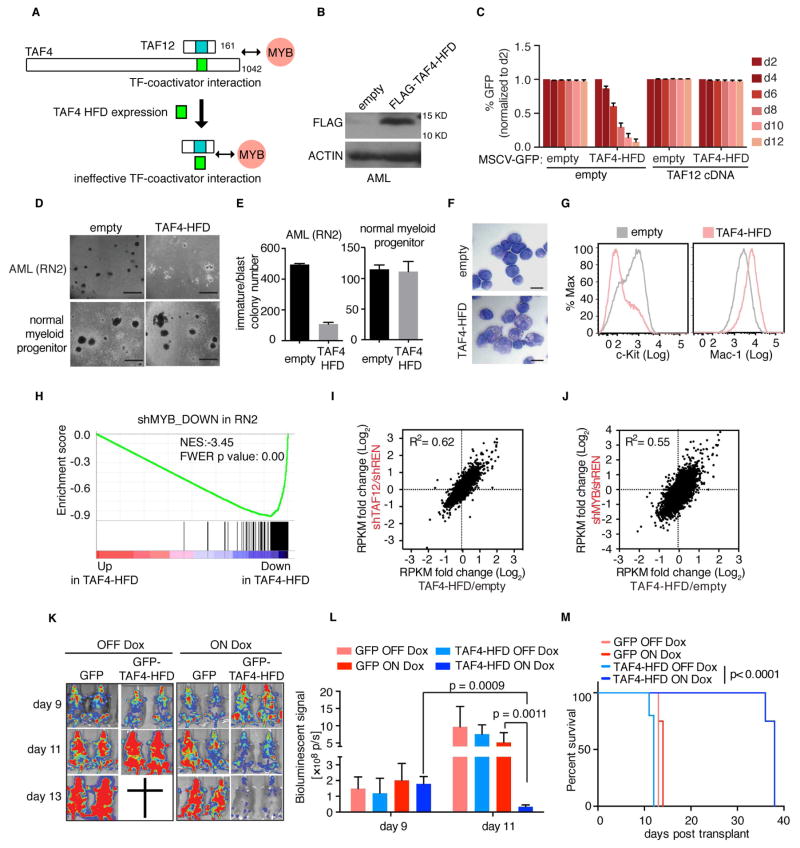
Figure 7. Squelching of TAF12 with a TAF4 HFD peptide leads to MYB suppression and anti-AML activity in vivo.
(A) Illustration of the TAF4-HFD based strategy for interfering with TAF12 and MYB function in AML.
(B) Western blot analysis of FLAG-TAF4-HFD expression in RN2 cells.
(C) GFP depletion assay evaluating the effect of retrovirally expressing the TAF4-HFD (linked to GFP) in RN2 cells. Prior to TAF4-HFD expression, RN2 cells were transduced with the TAF12 cDNA or empty vector.
(D) Bright-field images of methylcellulose-based colony formation assays in RN2 cells and normal myeloid progenitors expressing TAF4-HFD or empty vector on day 7 post viral transduction and day 5 post plating. Scale bar represents 1 mm.
(E) Quantification of immature/blast colonies in (D). Data are plotted as mean ±3SEM, n=3.
(F) May-Grünwald Giemsa staining of RN2 cells expressing the TAF4-HFD or empty vector (day 4 post infection). Scale bar represents 10 μm.
(G) Flow cytometry analysis of RN2 cells stained with antibodies against c-Kit and Mac-1 on day 4 post infection with TAF4-HFD or empty vector control.
(H) GSEA analysis of TAF4-HFD overexpression versus empty vector control in RN2 cells, evaluating effects on a MYB dependent gene signature, defined as the top 200 downregulated genes following MYB knockdown in RN2 cells.
(I–J) RNA-seq comparison of TAF4-HFD expression to TAF12 (I) or MYB (J) knockdown in RN2 cells. Scatter plot depicts the fold-change in RPKM values of 8,044 expressed genes (RPKM =5 in shREN) comparing two independent TAF12/MYB shRNAs or TAF4-HFD expression to control (shREN or empty vector, respectively).
(K) Bioluminescent imaging of mice transplanted with RN2 cells transduced with dox-regulated GFP-TAF4-HFD or GFP control. Mice were treated with dox in the drinking water and chow starting on day 9 and imaged on day 9, 11 and 13 following RN2 cells injection. 4 or 5 mice were used for each cohort.
(L) Quantification of bioluminescent imaging in (K). Values represent photons per second (p/s) of bioluminescent signal detection. p value was calculated using unpaired Student’s t-test. Data are plotted as mean ±3SEM, n=4–5.
(M) Survival curves of mice transplanted with RN2 cells transduced with dox-regulated GFP-TAF4-HFD or GFP. Mice were treated with dox in the drinking water and chow starting on day 9 following RN2 cell injection. p value was calculated by Log-rank (Mantel-Cox) test. n=4–5.
See also Figure S7.

