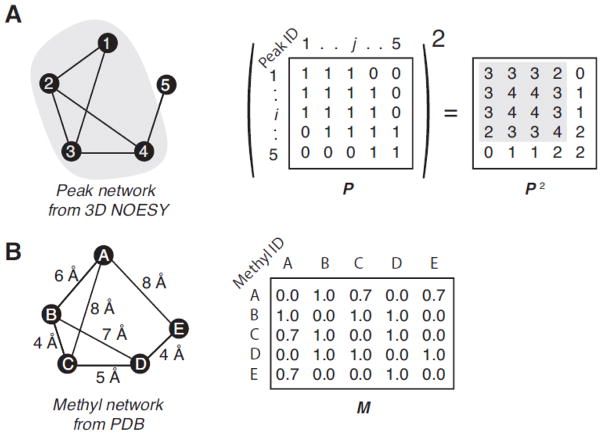
Figure 1. The peak network density matrix and the methyl network matrix.
Given the simple network (A) composed by five peaks and their connections, which are depicted by nodes and segments, respectively, the adjacency matrix, P, is built by all the non- zero value peak-peak interactions (here all set to one for simplicity) and the ith-row/column corresponding to the ith-peak. The square of P is the peak network density matrix used to define the peak cluster surrounding each peak. For instance, the second row of P2 describes the network density surrounding the 2nd-peak. Higher number indicates denser network, i.e. larger amount of connections per peak. The P2 elements that describe the association between the 2nd-peak and 3rd-peak are high because both peaks are closely involved in the same network, i.e. both have connections with the 1st- and the 4th-peaks. It is worth noting that the values describing the networking between the 1st- and 4th-peaks, which are not directly connected, are not null because both are connected to the 2nd- and the 3rd-peak. Then the 4×4 sub-matrix (highlighted in grey) is the dense portion of this simple network. Conversely, the P2 row corresponding to the 5th-peak contains only low values and is not involved in high-density networking. Considering the simple methyl-methyl network (B) composed by five methyls and their connections, which are depicted by nodes and segments, respectively, the adjacency matrix, M, is built with all connections having non-zero value and the ith-row/column corresponding to the ith-methyl.

