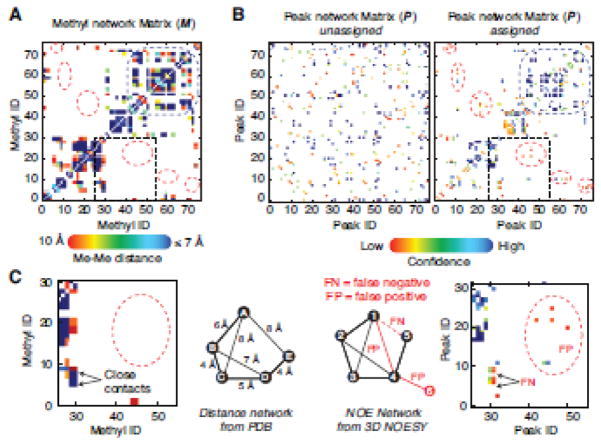
Figure 4. Peak network matrices in experimental data set.
The structure-based methyl network matrix (A) and the experimental 3D NOESY peak network matrix (B) for protein Abl-RM. The color grade (from red to deep blue) varies from 0 to 1 for the M matrix elements and from 0 to 4 for the confidence score or P matrix. For (B) both the starting and final peak network are shown. The P matrix starts from randomly distributed and converges during calculation to resemble M at the end of the run (left and right panel, respectively. The dotted red circles highlight discrepancies between the M and P that can be schematically represented by the simple networks shown in (C). M shows much higher density and represents the true connection pattern, while the P matrix shows several false negatives (FN) and false positive (FP). FN connectivities are those present in the structure but not in the data (due to dynamics or low s/n data or incomplete peak selection) and FP connectivities are those present in the data but not actually represented in M. The latter category indicates noise, incorrectly selected peaks or discrepancies between the structure and the data for example crystal vs. solution structure. The MAGIC algorithm deals with both by ranking FP and FN connections via the confidence score (S) matrix. For instance, FP connections receive a low confidence score in this example while FN connections do not impact the assignment in the high confidence portion of the network.

