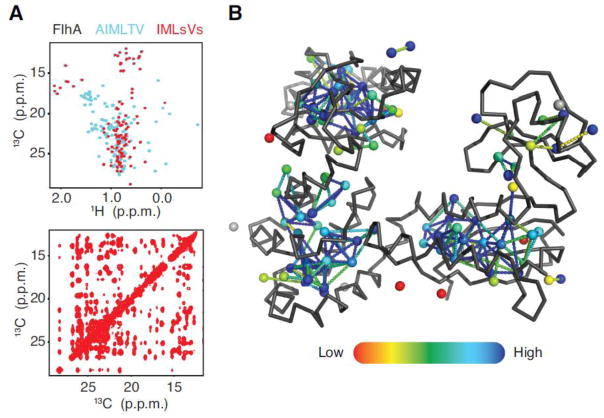
Figure 6. FlhA assigned by proS Leu and Val labeling.
The superposition of 2D 1H-13C HMQC from alternative labeling schemes (A top panel) full complement (cyan) and stereospecific methyl labeling (red) are displayed, along with the 13C-13C plane of 3D 1H-13C HMQC-NOESY-HMQC from stereospecifically-labeled sample (A bottom panel). Assignments (>94%) are mapped on FlhA coordinates. Each methyl and peak pair is displayed as a sphere with a color code ranging from 0 to 1 (red to blue) for the NOE assignment completeness of the related NOESY strip. The methyl-methyl connections, depicted as dashed-lines, are also colored according to their associated peak-peak connection confidence score (red to blue color gradient from confidence 0 to 2, and blue above 2). Unassigned methyls shown as grey spheres.

