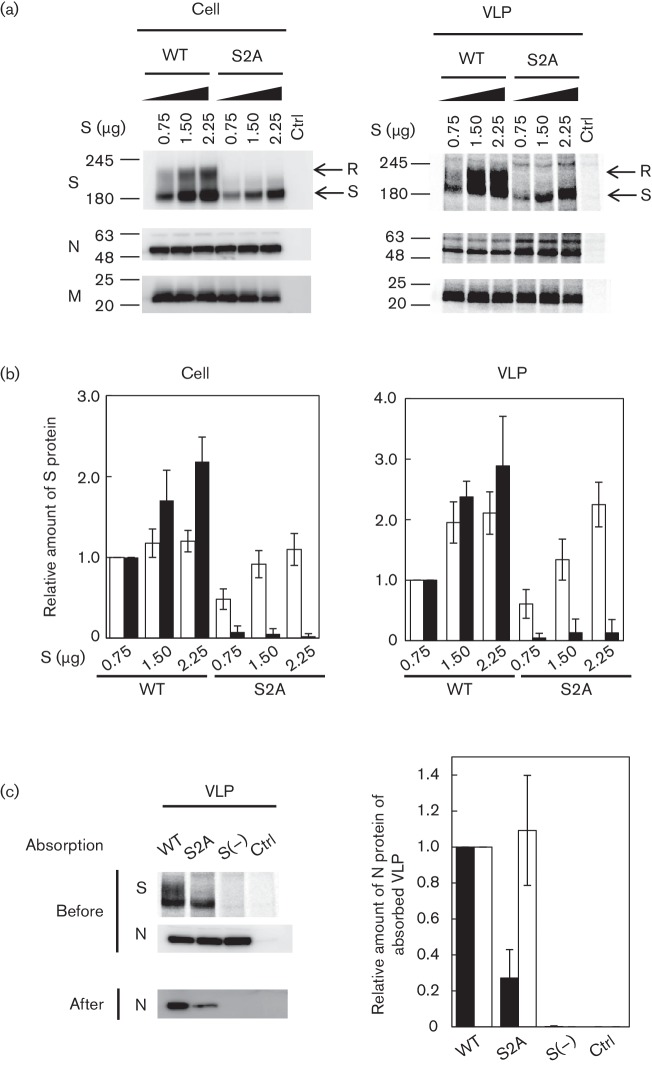
Fig. 6.
Incorporation of wtS and S2A proteins into VLPs and cell attachment experiment (a) 293T cells were co-transfected with 0.75–2.25 µg pCAGGS-S and a constant amount of pCAGGS-M, N and E. At 48 h post-transfection, cells were metabolically labelled for 18 h and released VLPs were analysed by SDS-PAGE (right). ellular S proteins were detected as described in Fig. 4 and cellular M and N proteins were immunoblotted using anti-M or -N rabbit serum. (b) To determine relative amounts of cellular S protein and S protein incorporation into VLPs, band densities corresponding to sensitive (open bar) and resistant forms (filled bar) were quantified and standardized to the density of M protein. Band densities corresponding to wtS proteins (0.7 µg plasmid transfected) in cells or VLPs were set to 1.0. Results are shown as means±sd from three independent experiments. (c) VLPs containing wtS and S2A proteins or VLPs without S proteins were absorbed to 293T cells expressing ACE2 on ice for 3 h, and N proteins of VLPs before and after cell attachment were detected by immunoblotting with anti-N rabbit serum and S pro teins of VLPs before were detected as described in Fig. 6(a). The density of N protein after cell attachment was normalized to that of N protein (filled bar) and total S protein (open bar) (right). The results are shown as the mean±sd from three independent experiments. The values ‘245', ‘180' and ‘135' represents molecular mass (kDa).

