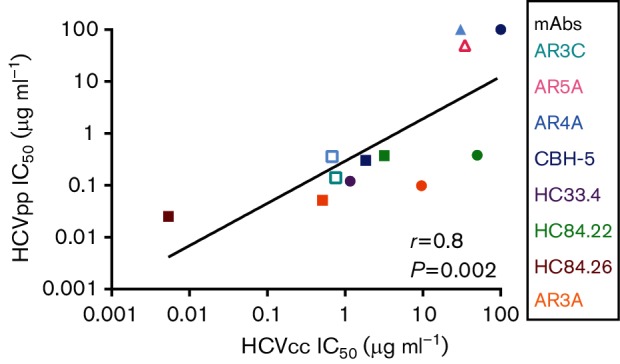
Fig. 5.

Positive correlation between the rank orders of IC50 values measured using E1E2-matched HCVpp and HCVcc. E1E2-matched HCVcc and HCVpp with five different E1E2 proteins (H77, 1a38, 1a53, 1b09 and 1b52) were tested in duplicate in neutralization assays with serial dilutions of up to four different bNAbs targeting distinct epitopes or control non-specific IgG (12 total bNAb/E1E2 combinations). HCVpp and HCVcc IC50 values were calculated from these curves. Each point indicates the HCVcc IC50 on the x-axis and HCVpp IC50 on the y-axis of E1E2-matched HCVcc and HCVpp. For neutralization curves with only the highest antibody concentration (50 µg ml−1) producing more than 50 % neutralization, IC50 is graphed as 50 µg ml−1 and for curves with maximum neutralization less than 50 %, IC50 is graphed as 100 µg ml−1. Colours indicate mAb tested (cyan, AR3C; pink, AR5A; light blue, AR4A; dark blue, CBH-5; purple, HC33.4; green, HC84.22; red, HC84.26; orange, AR3A) and shapes indicate E1E2 sequence (▲, 1a38; □, 1a53; ⚫, H77; △, 1b52; ■, 1b09). Correlation (r) and P value were computed using the Spearman method.
